TopMod QA Knowledge Base
Detailed instructions on the use of the TopMod QA Recording Application and Dashboard
- First Time User Guide: Recording Application
- Introducing TopMod QA 2.2
- Further Information: Sessions & Events
- First Time User Guide: Session Viewer & Dashboard
- Feature Announcements
- First Time User Guide: Managing Your Workspace
First Time User Guide: Recording Application
To kick off our First Time User Guide series, this article walks through the process of downloading, installing and creating your first session in TopMod QA.
This process has been designed to be as streamlined as possible whilst also giving you control over what you capture and when.
User Guide
1. Download & Install Application
To download the latest version of the Recording Application, login to your TopMod QA account in the TopMod QA dashboard by visiting here: http://app.topmodqa.com/ and entering your login details. For more information on how to login to the dashboard, please read our First Time User Guide for the Dashboard.
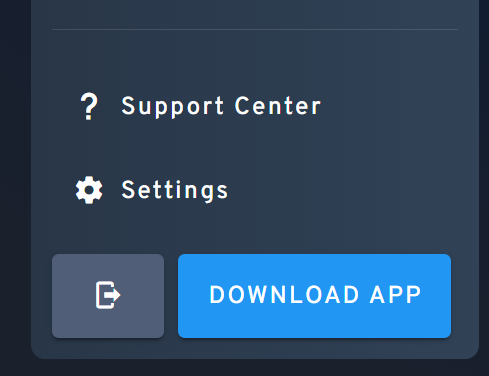
After logging in, click the "Download App" button in the bottom left of the screen - as seen below.
After downloading, locate the installer and follow the installation process. Please note, due to the level of data capture taking place within the recording process (user inputs and performance data), this application does require you to restart your machine as part of the installation process.
2. Login
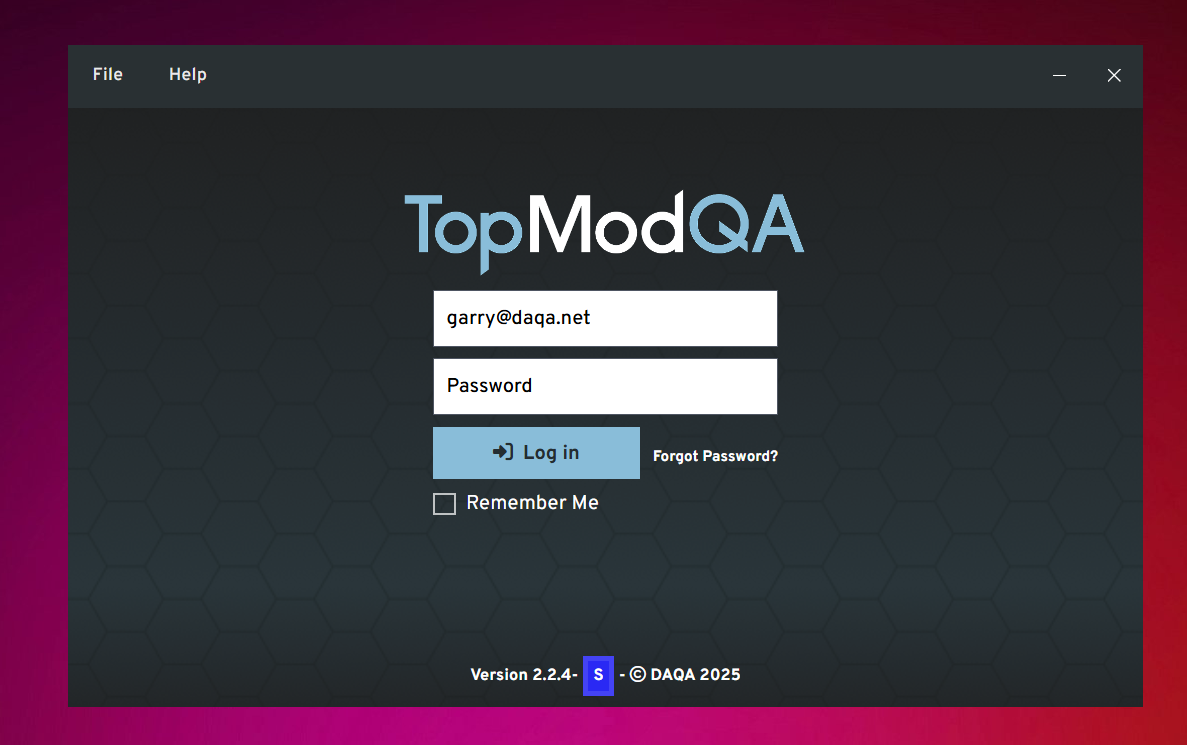
After downloading and installing the latest version of the Recording Application, opening the application will take you to the Login screen as seen above. Enter the same login details you entered into the Dashboard to continue.
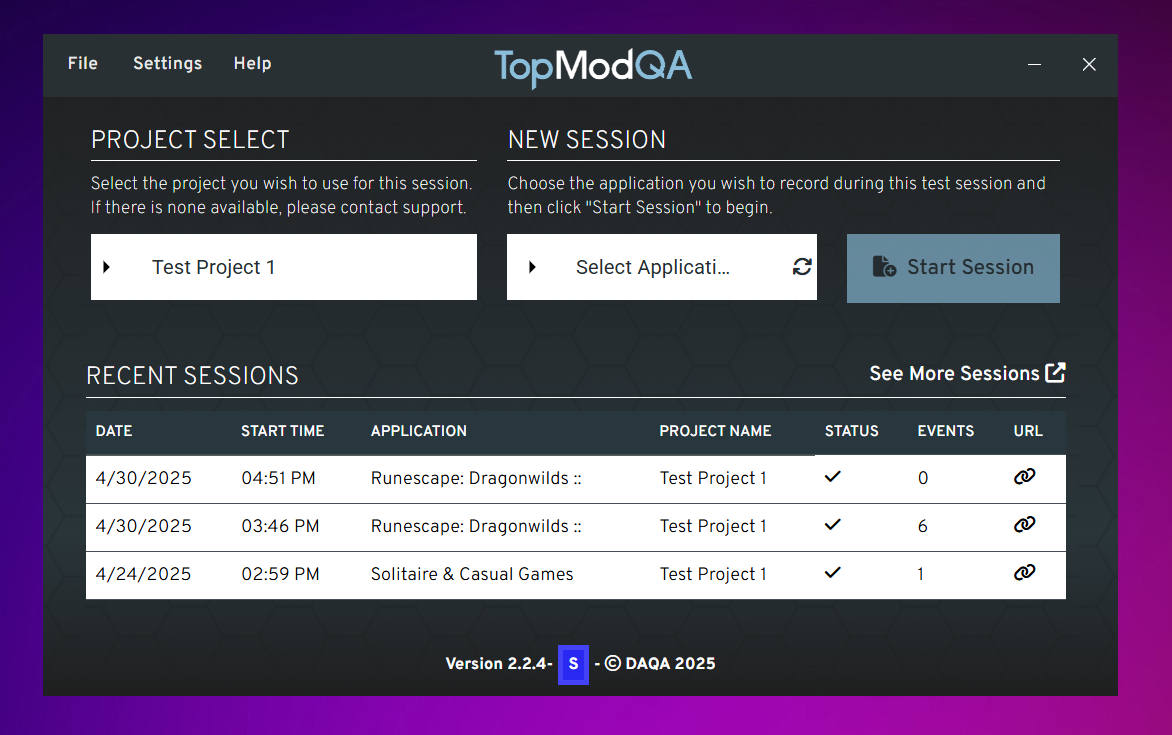
3. Homepage

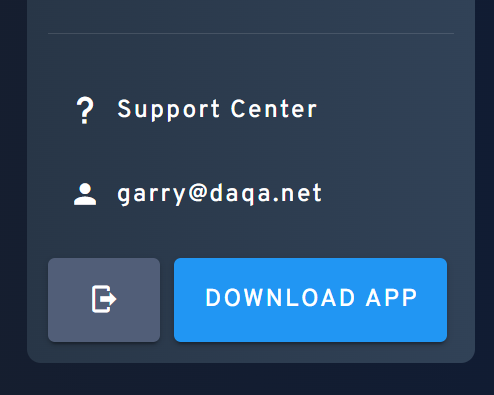
The first screen to become familiar with is the Homepage. On this screen, you have the ability to view your latest Sessions, start a new Session, check your Settings or visit the Support Centre for more information.
As our focus is on recording your first Session, we are going to focus on the specific features to do this.
4. Checking your webcam and microphone
As TopMod QA offers the ability to capture the users webcam and microphone during any recording, it's best to check in your Settings to ensure they are properly being picked up by the application. To do this, click the "Settings" button in the top navigation bar.
This will open the Settings screen and you should see that the Application has detected your webcam and microphone automatically. If you have multiple devices connected and would like to change which device is being used, click the white box and select the new device from the dropdown menu.
If you are not seeing a device being picked up by the Application, try restarting your Recording Application and the host PC to see if this helps connect the device to the application. If you continue to have problems, please reach out to our Support team at support@topmodqa.com.
Once you have tested your devices are working properly, click the "Save & Close" button in the bottom left of this screen. Clicking this button will save your settings for future recordings and ensure you do not have to do this each time you want to start a new Session.
5. Project & Application Select
After saving your settings, you will be redirected to the Homepage. From here, we are going to start the process of setting up a new Session. To start with, you will need to select which Project this Session will be for. To do this, click on the dropdown menu (white box) below the "Project Select" header.
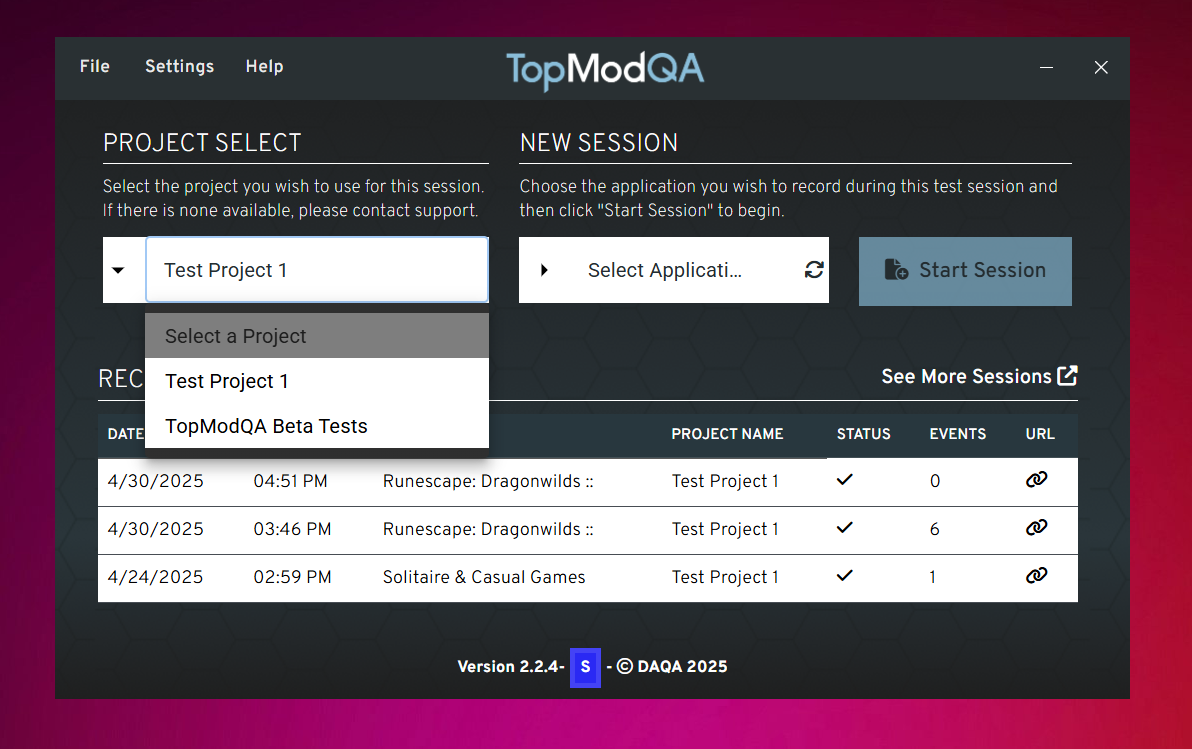
From there, you will need to select the application you are going to focus on during this Session. To do this, click the white box with "Select Application" in it. This will provide you with a list of all the applications currently running on the host PC. Select the application you'd like to focus on.
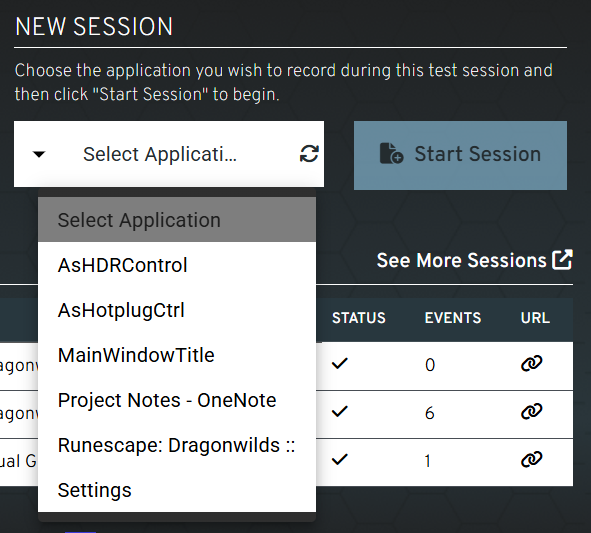
Please note, if you do not see your target application in this list, click the rotating arrow icon on the "Select Application" menu. This will refresh the list of Applications and you should see your target application appear.
6. Start Session
Once you have selected your Project and Application, click the "Start Session" button to begin.
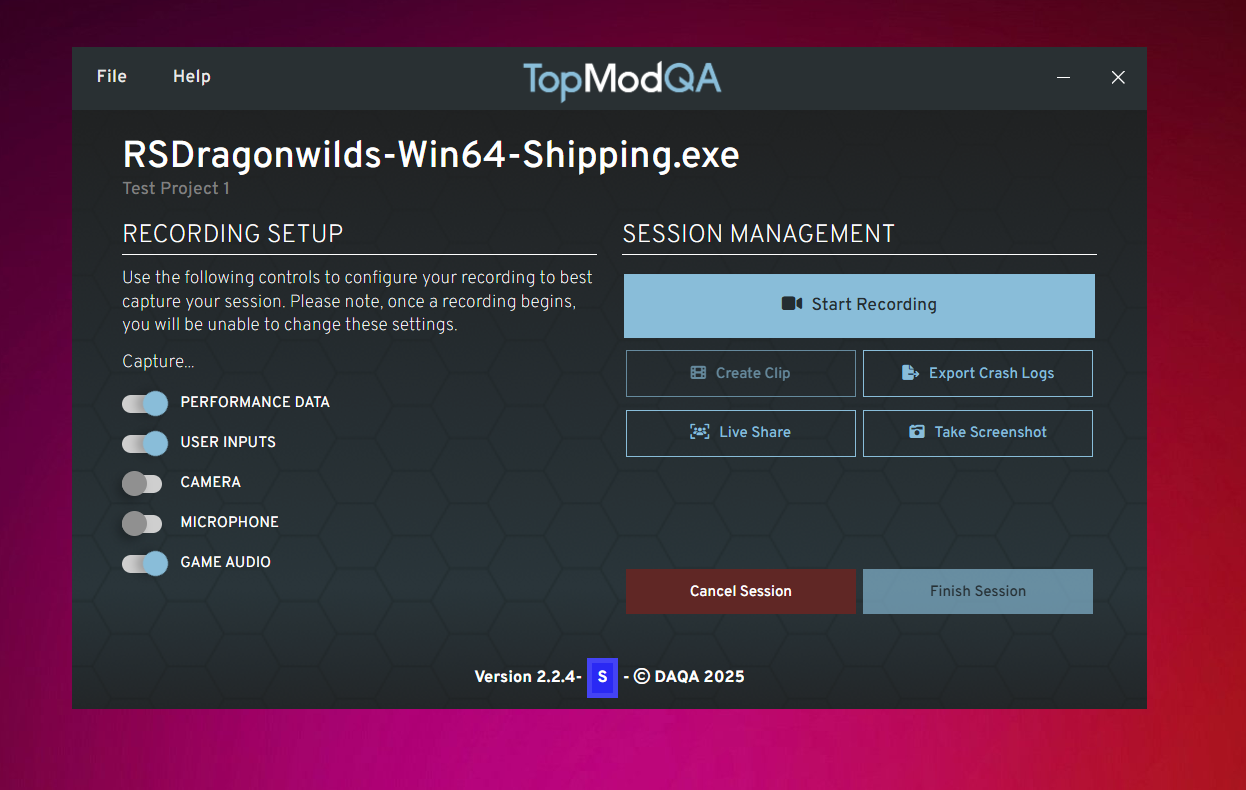
You will then be taken through to the Session page which will be your primary hub for this Session. In here, you will have the ability to configure what is being captured as part of the recording, as well as being able to manage the Session itself.
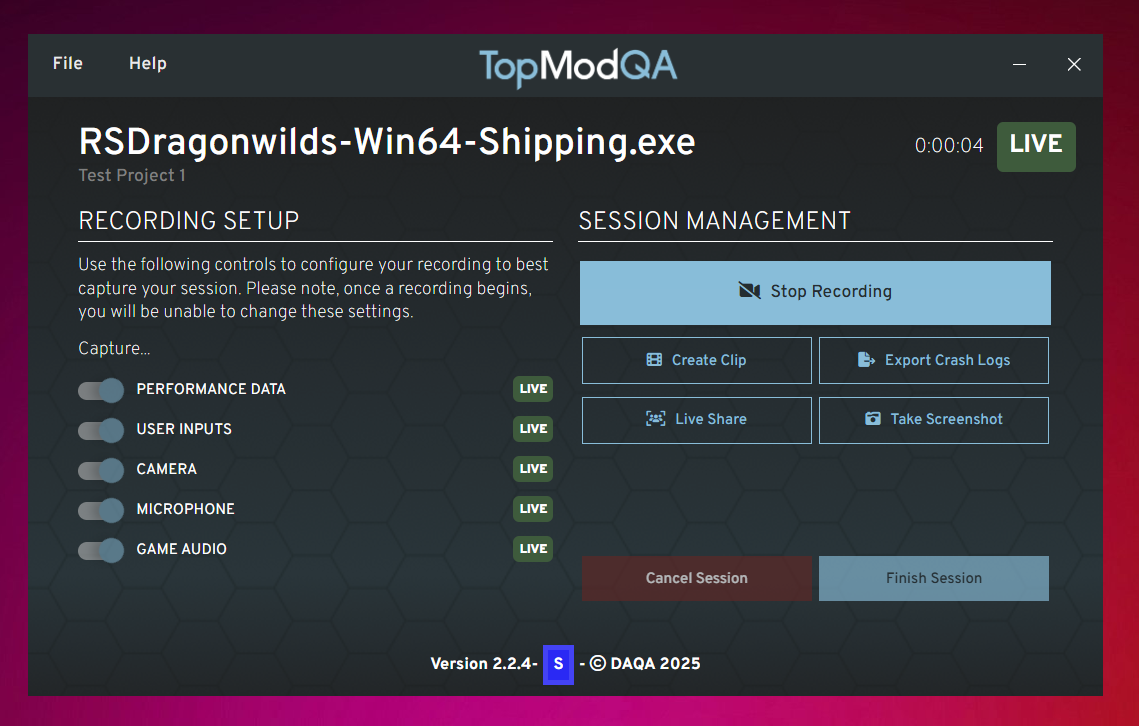
7. Recording Setup
As this is our first Session, we should configure what inputs you'd like to capture as part of this Session. It's important to remember that this can be configured for different Events inside the same Session so anything you set here now can be updated again as you progress through your testing session.
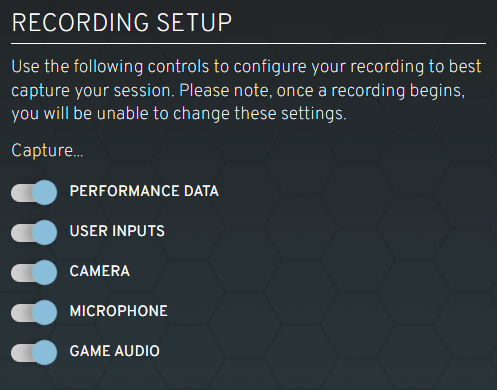
To turn any specific captured input off, simply click the toggle next to its title.
8. Session Management
Once you have set your capture inputs, you are ready to begin capturing Events. As outlined in our supporting article, Events form a key part of the new TopMod QA setup. Grouped by Sessions, Events can be any Recording, Clip or Screenshot you capture whilst testing.
A Recording represents a long recording of the test session, it may be of your entire test session or if your test session is long, you may break this up into multiple Recordings. Whereas, a Clip is a short video clip taken from your main Recording. This is great if you encounter a bug in your session and would like to include the footage on a bug report.
The Session Management panel houses all of your controls for your Events. Please note, to create a Clip, you must have already been Recording so it's our recommendation to start recording as soon as you start your test session to avoid missing anything of value.
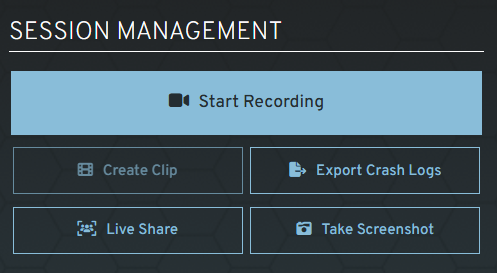
There are also two additional Events in the Session Management panel. We are not going to cover these in this article but you can read more about them here: Further Information: A... | TopMod QA DocsFurther Information: S... | TopMod QA Docs
9. Capture Screenshot
At any time, you may wish to capture an image at any time whilst you are running your Session. To do this, simply click the "Take Screenshot" button in the Session Management panel. This can be done without the main Recording running.
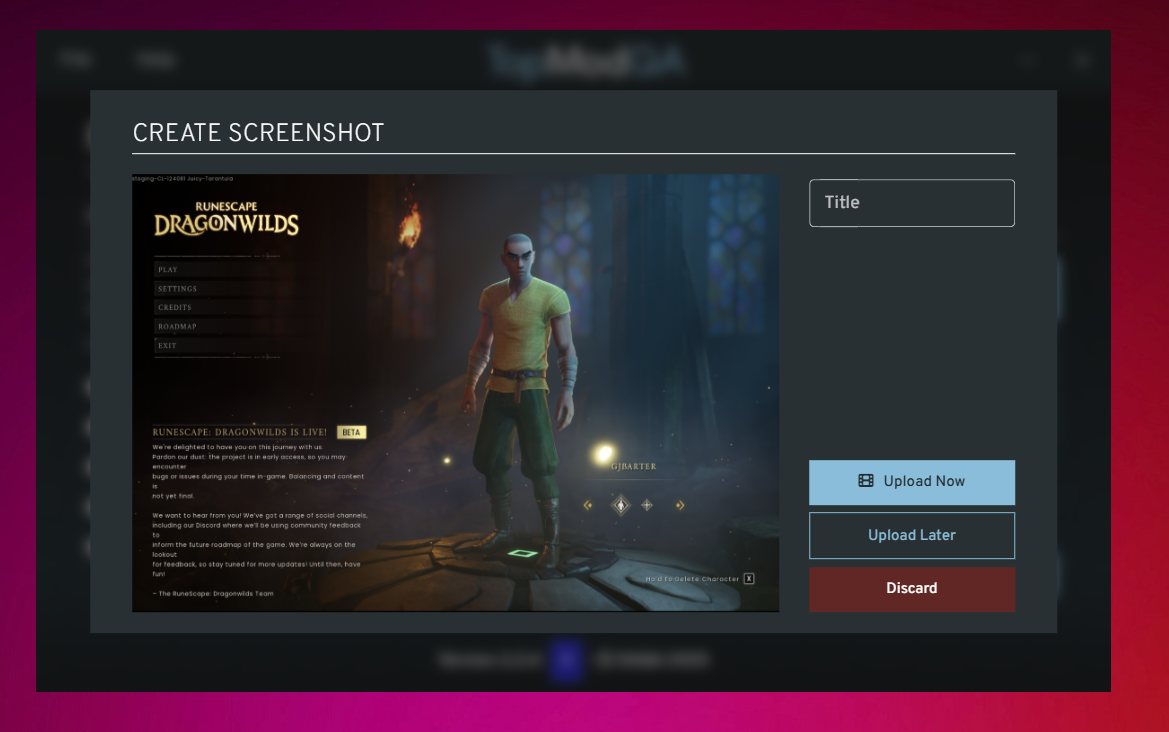
Upon the capture of the Screenshot, you will be presented with the above modal showing the Screenshot that was captured. This capture is done in the native resolution of your screen so can be great for sharing any UI or text issues you encounter in your test session.
When reviewing the captured Screenshot, if you would like to keep the Screenshot so you can share with others, add a Title and click the "Upload Now" button. This will immediately begin the upload process and it will become available in the Dashboard whilst the rest of your Session continues.
If you are unsure of whether you'd want to upload the Screenshot, or you do not want to impact your network connection, you can choose to upload the Screenshot later by selecting "Upload Later". If you do not want to keep the Screenshot, click the "Discard" button.
In this instance, click the "Upload Now" button.
10. Start Recording
As the aim of this article is to demonstrate how to record your test session with TopMod QA, we're now going to show how to create recordings. To begin recording, click the "Start Recording" button in your Session Management panel.
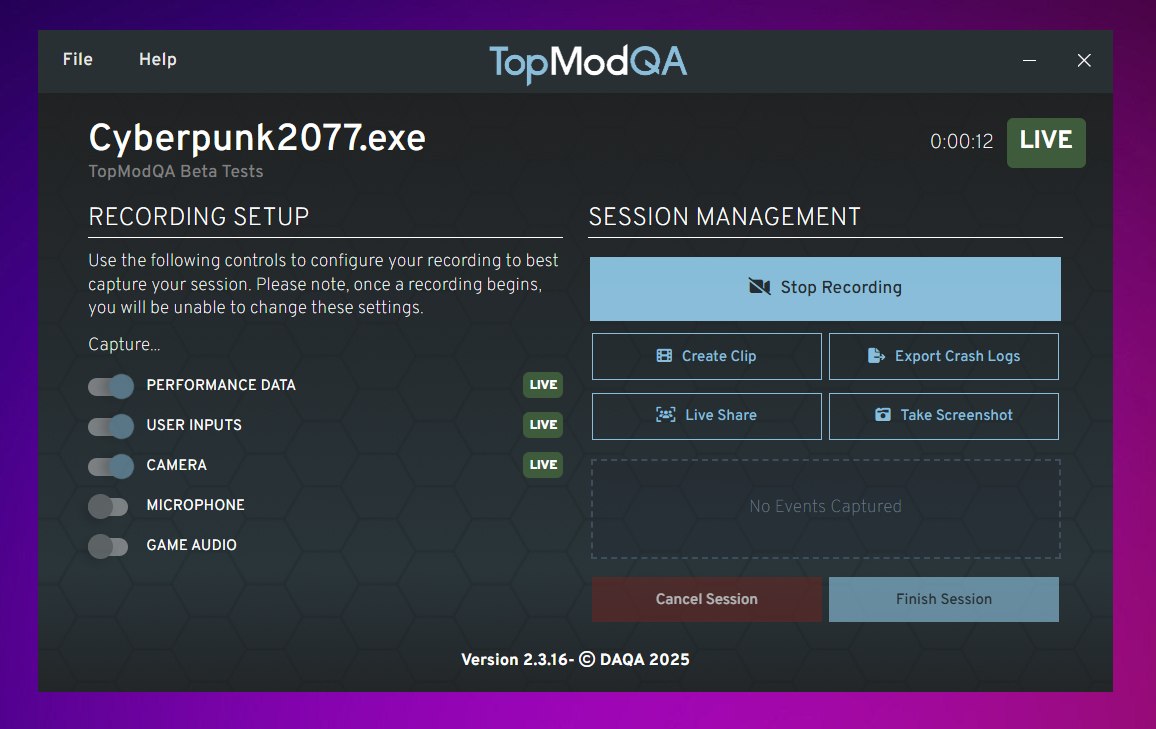
Once the application is recording, you should see a number of UI elements change on the Recording Application. Firstly, you should see a number of "Live" states appear, this will show you whether the full application is capturing the gameplay from your chosen application, as well as any additional inputs you've selected in the "Recording Setup".
If any of these "Live" tokens show as "Error", this means the Recording Application is unable to capture that specific element. Try restarting the recording and if the error persists, try reloading the Recording Application and restarting the host PC. If the issue persists, please contact support at support@topmodqa.com.
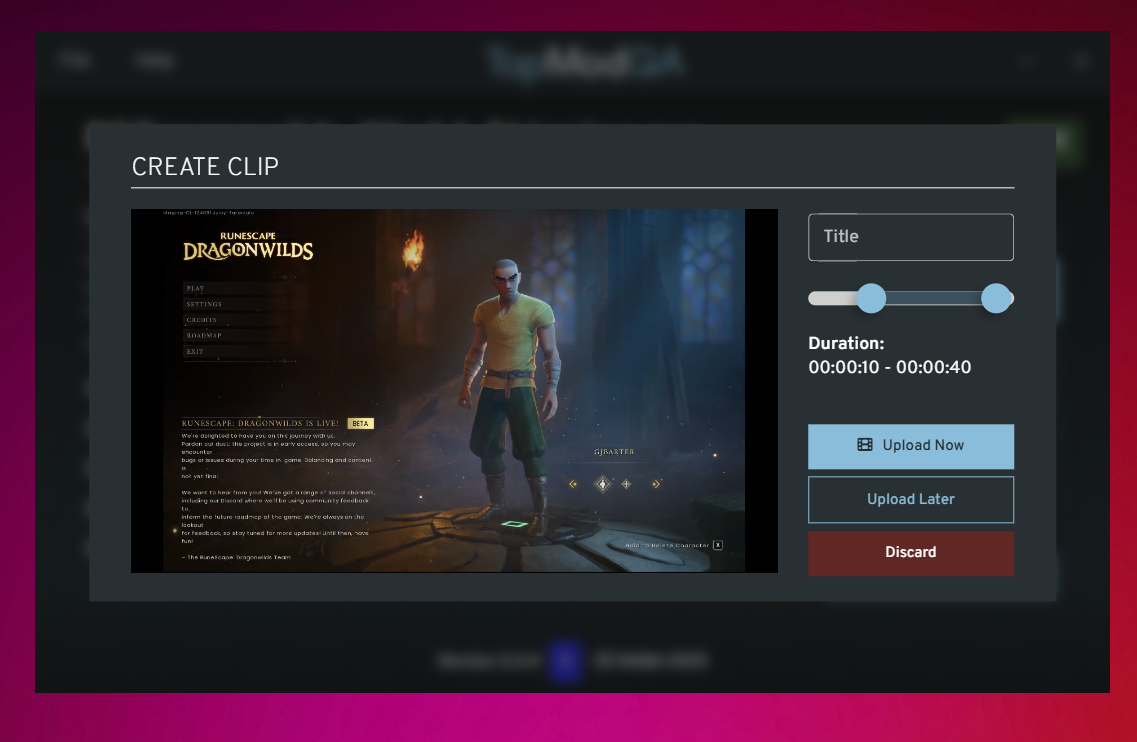
11. Create Clip
As your test session continues, you may encounter a part of the game that you'd like to specially capture and upload to a bug report ticket. To do this, click the "Create Clip" button in the Session Management panel.

As with the Screenshot event, the Clip modal will appear and you'll be able to playback the Clip that you've just captured. The clipping functionality allows playback of up to 5 minutes and you control the start and end point of the Clip by adjusting the scrubber below the Title input. If you'd rather just capture the full window of the Clip, set the scrubbers to the start and end of the available scrubbing element.
Again, as we did with Screenshots, you can then add a Title to the clip and choose whether you want to Upload the Clip now (making it available in the Dashboard), Upload later or Discard the Clip.
In this instance, click the "Upload Now" button.
12. Finish Recording & Session
Once you are finished recording your Test Session, simply click the "Stop Recording" button in the Session Management panel to end the recording. Please note, you can have multiple Recordings as part of any Session so should you want to restart recording, click "Start Recording".
After the Recording has stopped and the "Live" elements on screen have disappeared, you can decide whether you want to Finish the Session or Cancel the Session. Cancelling the Session discards the whole Session and any Events captured so only do this if you want to completely remove the Session.
If you are ready to Finish the Session, click the "Finish Session" button.
13. Review Session
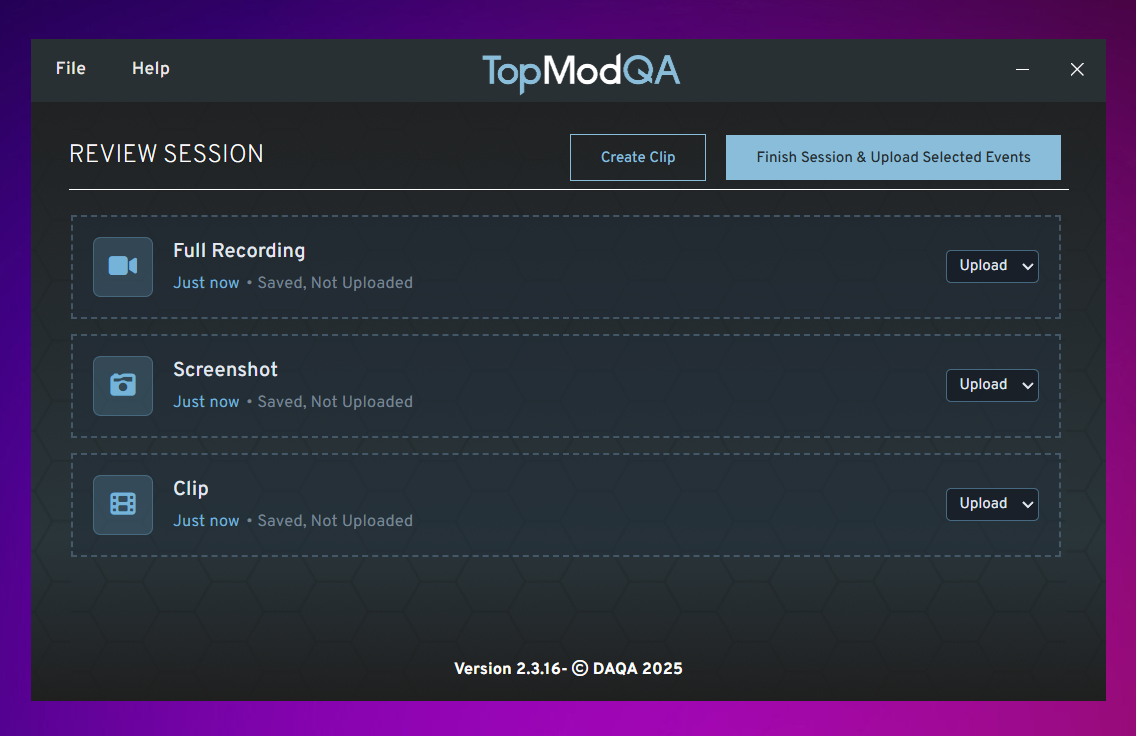
After you have clicked on the "Finish Session" button in the Session Management page, you will then be directed to a final screen where you have the chance to review your captured events. This screen allows you to:
- Decide whether you'd like to upload any Events that you haven't already uploaded.
- Review and recover any previously discarded Events
- Create a new Clip from any of your full Recordings should you have missed anything.
Once you have reviewed all outstanding Events in the Session and finished with your Session, click the "Finish Session & Upload Selected Events". This will start the upload process and take you back to the recording applications homepage where you can see track your upload via the status section.
14. View Session
Now that the Session has finished, you will likely want to view your Session. To do this, find your Session in the "Recent Sessions" section of the Homepage and click the corresponding paperclip icon on the far right of the table. This will copy the URL for the Session to your clipboard.
You can then take this and paste it into your favourite web browser to view the Session in the TopMod QA Dashboard. To find out how to use the Dashboard and find key information related to your Session, read our First Time User Guide of the Dashboard by clicking here - First Time User Guide:... | TopMod QA Docs
Introducing TopMod QA 2.2
TopMod QA's latest release represents the most significant shift in the product since it's inception. The latest version (2.2) has been rebuilt from the ground-up to dramatically improve the quality of the testers experience.
Refreshed User Interface
We took a big step back and reviewed the overall purpose of TopMod QA and where it fits within the average games testers toolbox. Doing this allowed us to look at the complete user journey of the Recording application and this led to us overhauling the user interface with the aim of giving testers more control of how they record and share clips from their test sessions.
As seen above, we've simplified the process of starting new test sessions by combining multiple screens in the previous version into one central hub. From this new homepage, you can view past recordings, start new recordings, change projects and more.
The biggest change to the Recording application comes within the sessions themselves. Rather than taking you down a set path, we now open up single Sessions where you can control exactly what is being captured and when. To do this, we've introduced a new concept of Sessions and Events. For more on this, take a look at our "Getting Started" video below.
Standalone Dashboard
TopMod QA previously utilitised Microsoft's Sharepoint platform for testers to upload and share footage from their recordings. To give ourselves more flexibility, reduce the resources required by the host machine and to allow us to build more powerful features in the future, we have replaced this with our own dashboard - http://app.topmodqa.com/
Through this new dashboard, you can easily find your past recordings, view all of the Events captured for a specific Session and review others recordings, all in one place. This is the start of a journey for us and we're going to be adding more features to this over the coming months.
Improved Infrastructure
Alongside the changes to the native application and the introduction of the TopMod QA dashboard, we've also rebuilt the way recordings are handled behind the scenes. Through the introduction of the dashboard and some changes in our infrastructure, we've moved all of the processing away from the host machines and instead, this is all handled in the cloud.
This results in a much smoother process when capturing footage, lower overheads on the game you are capturing and a generally much fast process using the application. All we now ask you to do is upload footage, and then we take care of the rest!
We're excited about the future of TopMod QA and we hope you enjoy the changes made as part of this new update.
Additional Guides and Tutorials:
Further Information: Sessions & Events
With the introduction of version 2.2, TopMod QA has introduced the concept of Sessions and Events. Sessions represent a container for all recordings and other events captured as part of a users test session. Events represent everything that takes place within the Session. The aim of this is to make the process of using TopMod QA more accommodating to the different scenarios encountered by testers every day.
Types of Event
Recording
A Recording in TopMod QA is the main recording that runs whilst you test a game. You start this within the Recording App by clicking to "Start Recording" and features all of the inputs you have selected to capture in the "Recording Setup" panel.
Depending on the nature of your Session, you may not want the longer recording attached to the Event but this can be extremely useful if you want to give feedback to the Development team or capture the reaction of the tester whilst they play a game.

Screenshot
A Screenshot can be taken at any time once the Session has started in the Recording Application. It captures the full resolution of the target application (game you are testing) and is viewable inside the Dashboard once it's been uploaded.

Clip
A Clip is a shorter recording than the main Recording Event detailed earlier and is specifically used if the tester captures something during their Session that they want to share with others easily. It is smaller in length than the main Recording event.
Live Share
Not Viewable in Dashboard
Should at any point the tester want to share their gameplay screen with a colleague, they can utilise the Live Share Event functionality. By clicking the Live Share button in the Session Management panel in the Recording App, the tester is given a URL to share with another person. Once the other person clicks that URL, they are able to view the screen of the tester and talk directly with them.
Please note, Live Share is only available for direct communication with one person, multi-viewers is not supported yet.
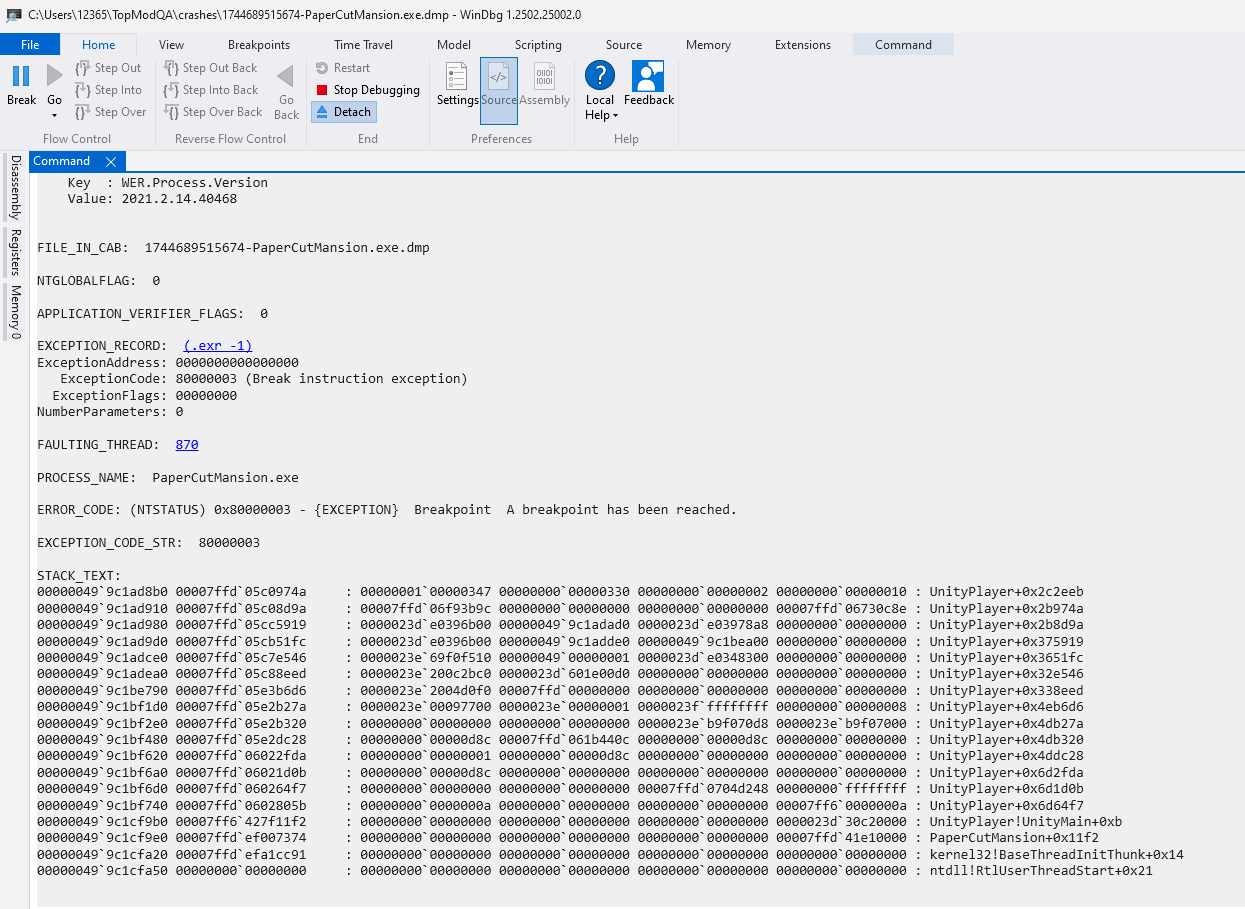
Export Crash Logs
Not Viewable in Dashboard
Should the tester encounter a crash inside the game they are testing, they can immediately click the "Export Crash Logs" button in the Session Management section of the Recording App. This will generate the crash logs for the target game and save them to the Save Location set in the Settings page.
The output of the Export Crash Logs function acts as a memory dump similar to the type of feature found in Visual Studio. An example of the output can be found below.
First Time User Guide: Session Viewer & Dashboard
As a continuation of our First Time User Guides series, this article provides a step by step process on how to find Sessions in the TopMod QA dashboard and view the various Events captured via the Recording application.
As a recap, TopMod QA has two applications as part of its service. The first is the native recording application that is installed onto the testers machine and the other is the dashboard which is used to view captured sessions. This article is focused on the dashboard, if you require help with getting started with the recording application, please click here.
User Guide
1. Login
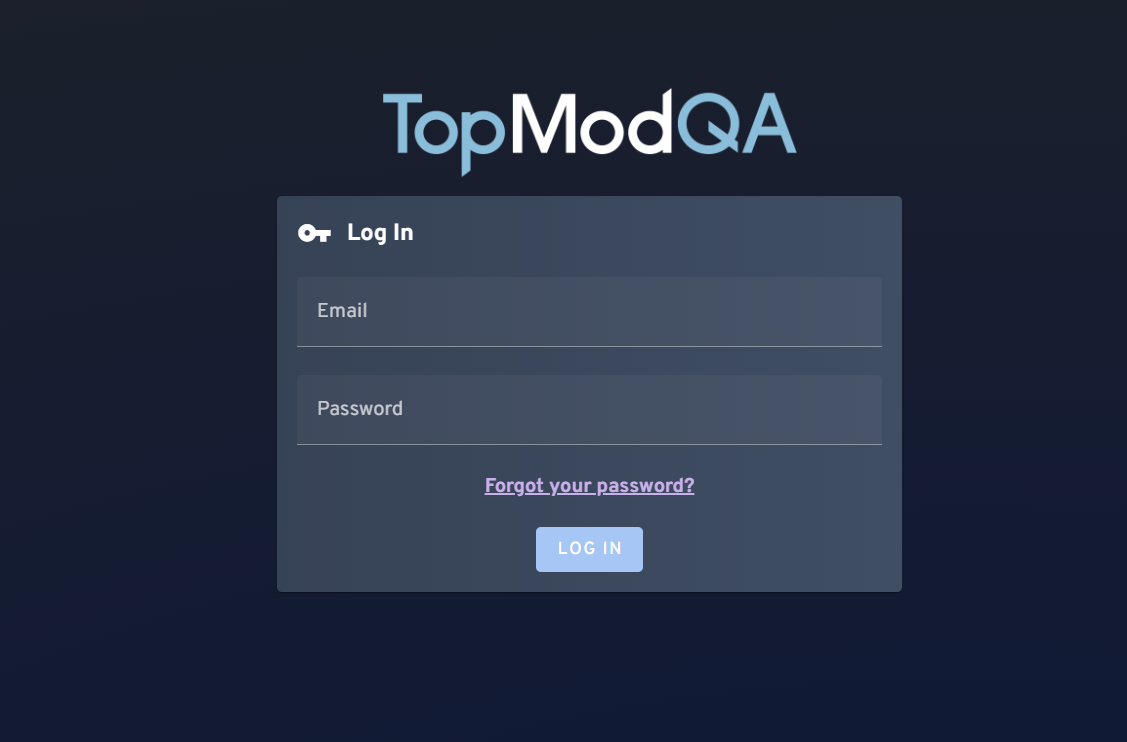
To login to TopMod QA, head to https://app.topmodqa.com/ and enter the login details provided to you previously. If you do not remember your password, click on the "Forgot Your Password?" link or click here: https://app.topmodqa.com/auth-management. Please note, you must have access to the email address associated to your account to receive the forgotten password email.
2. Finding a Session
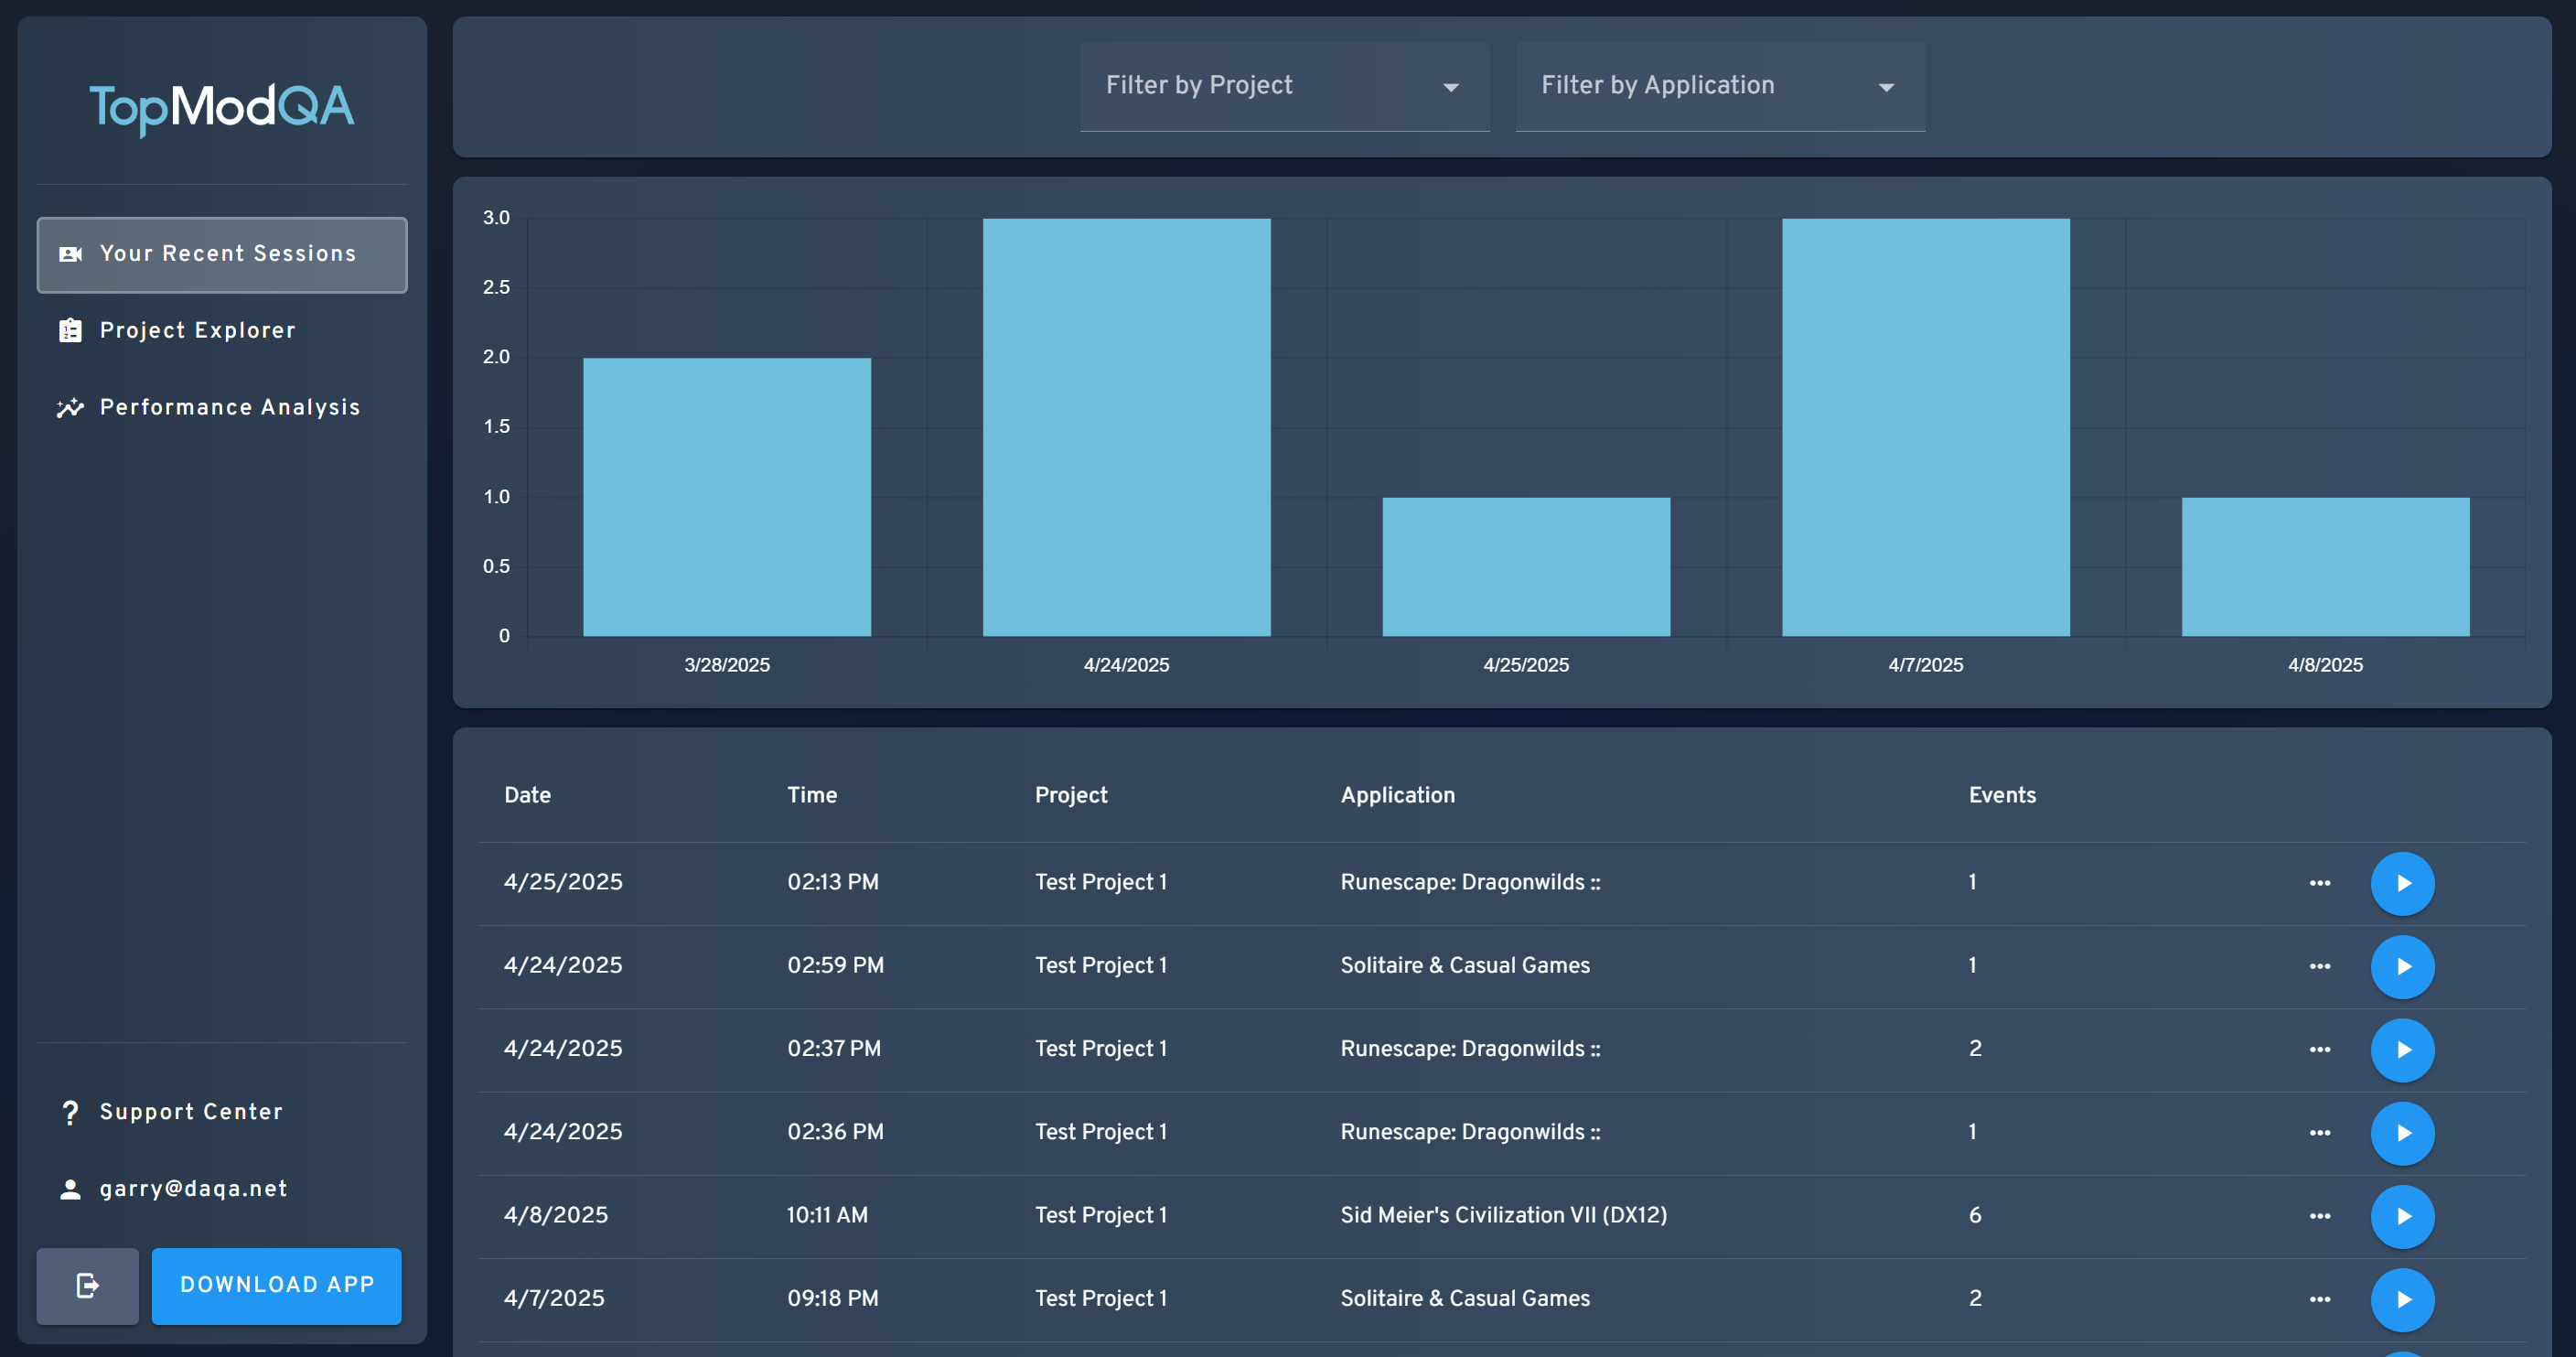
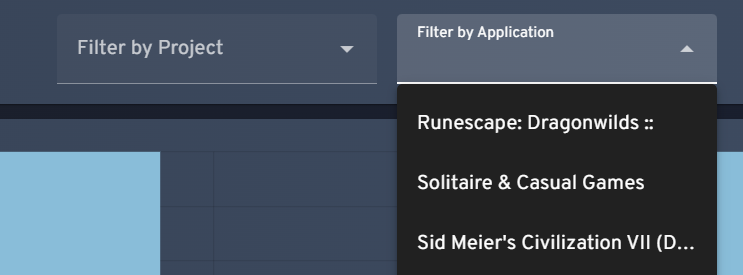
Once logged in, you'll be directed to "Your Recent Sessions" page. This page displays all of your uploaded Sessions, arranged chronologically with your most recent Session displayed at the top of the list. If you would like to find a Session associated to a specific Project or Application, you can do so using the dropdown menus at the top of the page.
Once you have found the Session you'd like to view, click the blue circle with the play icon in to open the Session for further review.
If you are unfamiliar with how TopMod QA manages Sessions and Events within, we have created a short explainer video which can be found here: Introducing Sessions &... | TopMod QA Docs
3. Review a Session
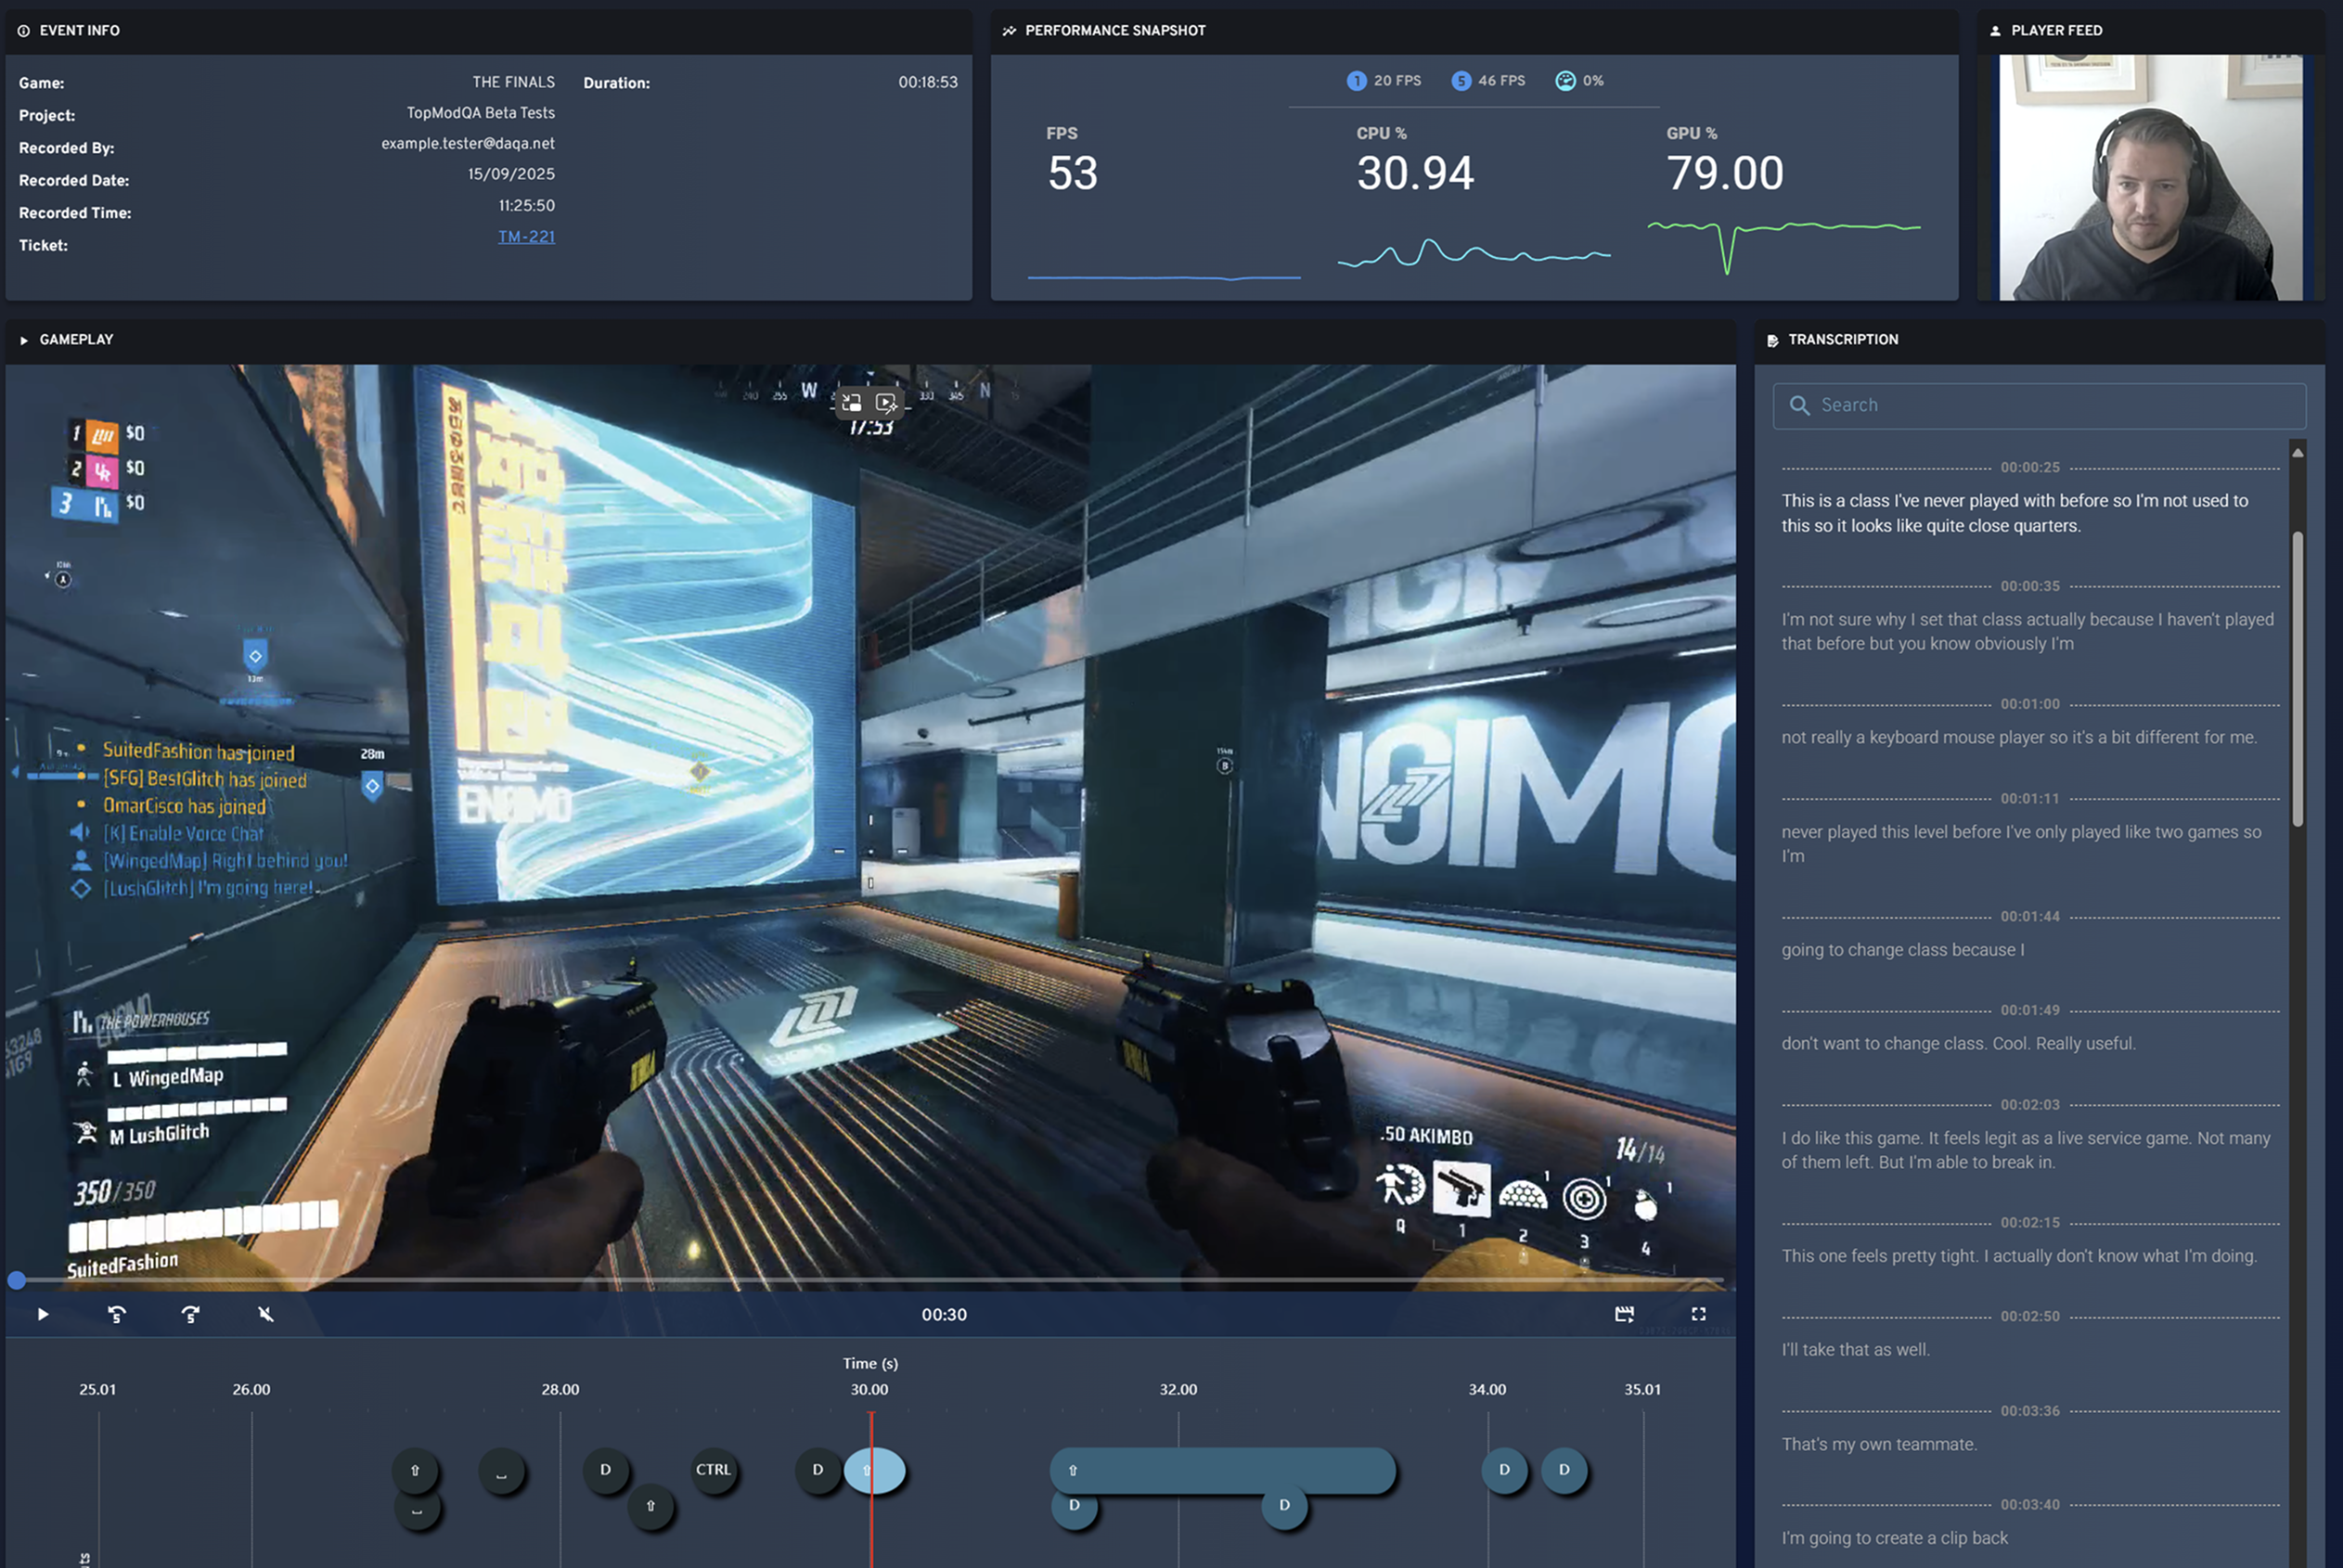
Upon opening your selected Session, you'll be presented with our Session View page. This page includes some key information including:
- The Session information including the email of the tester who uploaded the Session, number of events and the amount of hours recorded in the session.
- The Performance averages across each event captured
- The Event Timeline
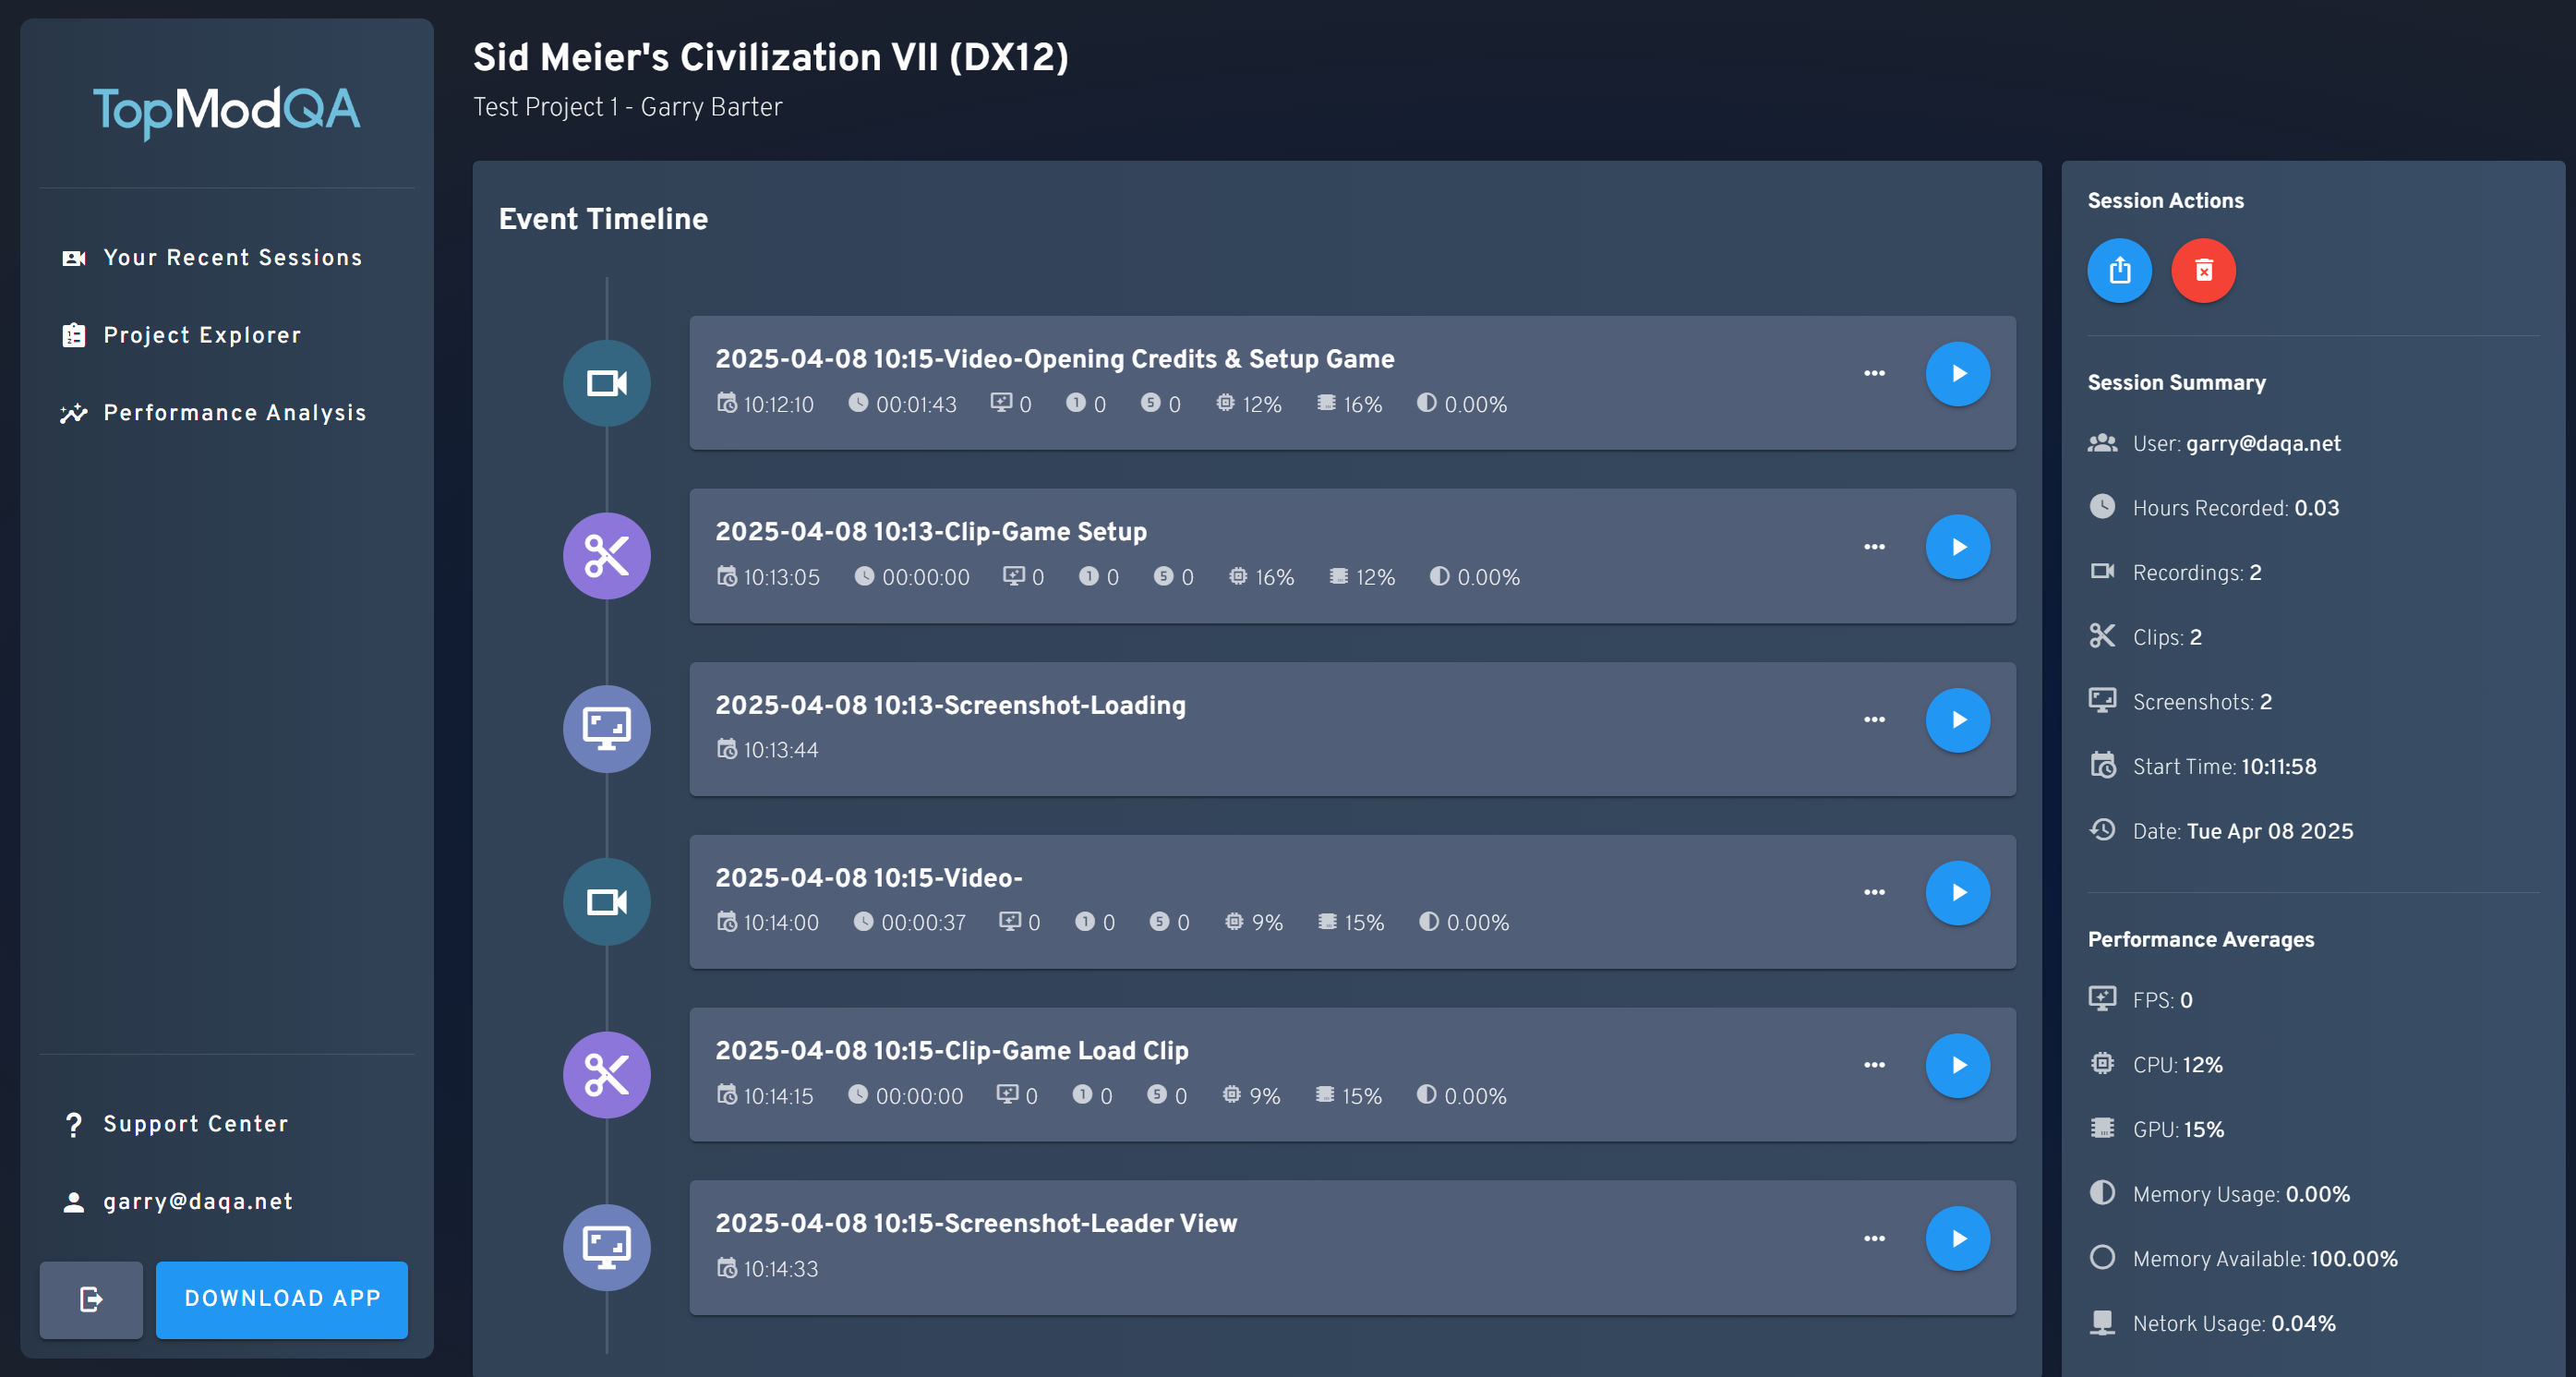
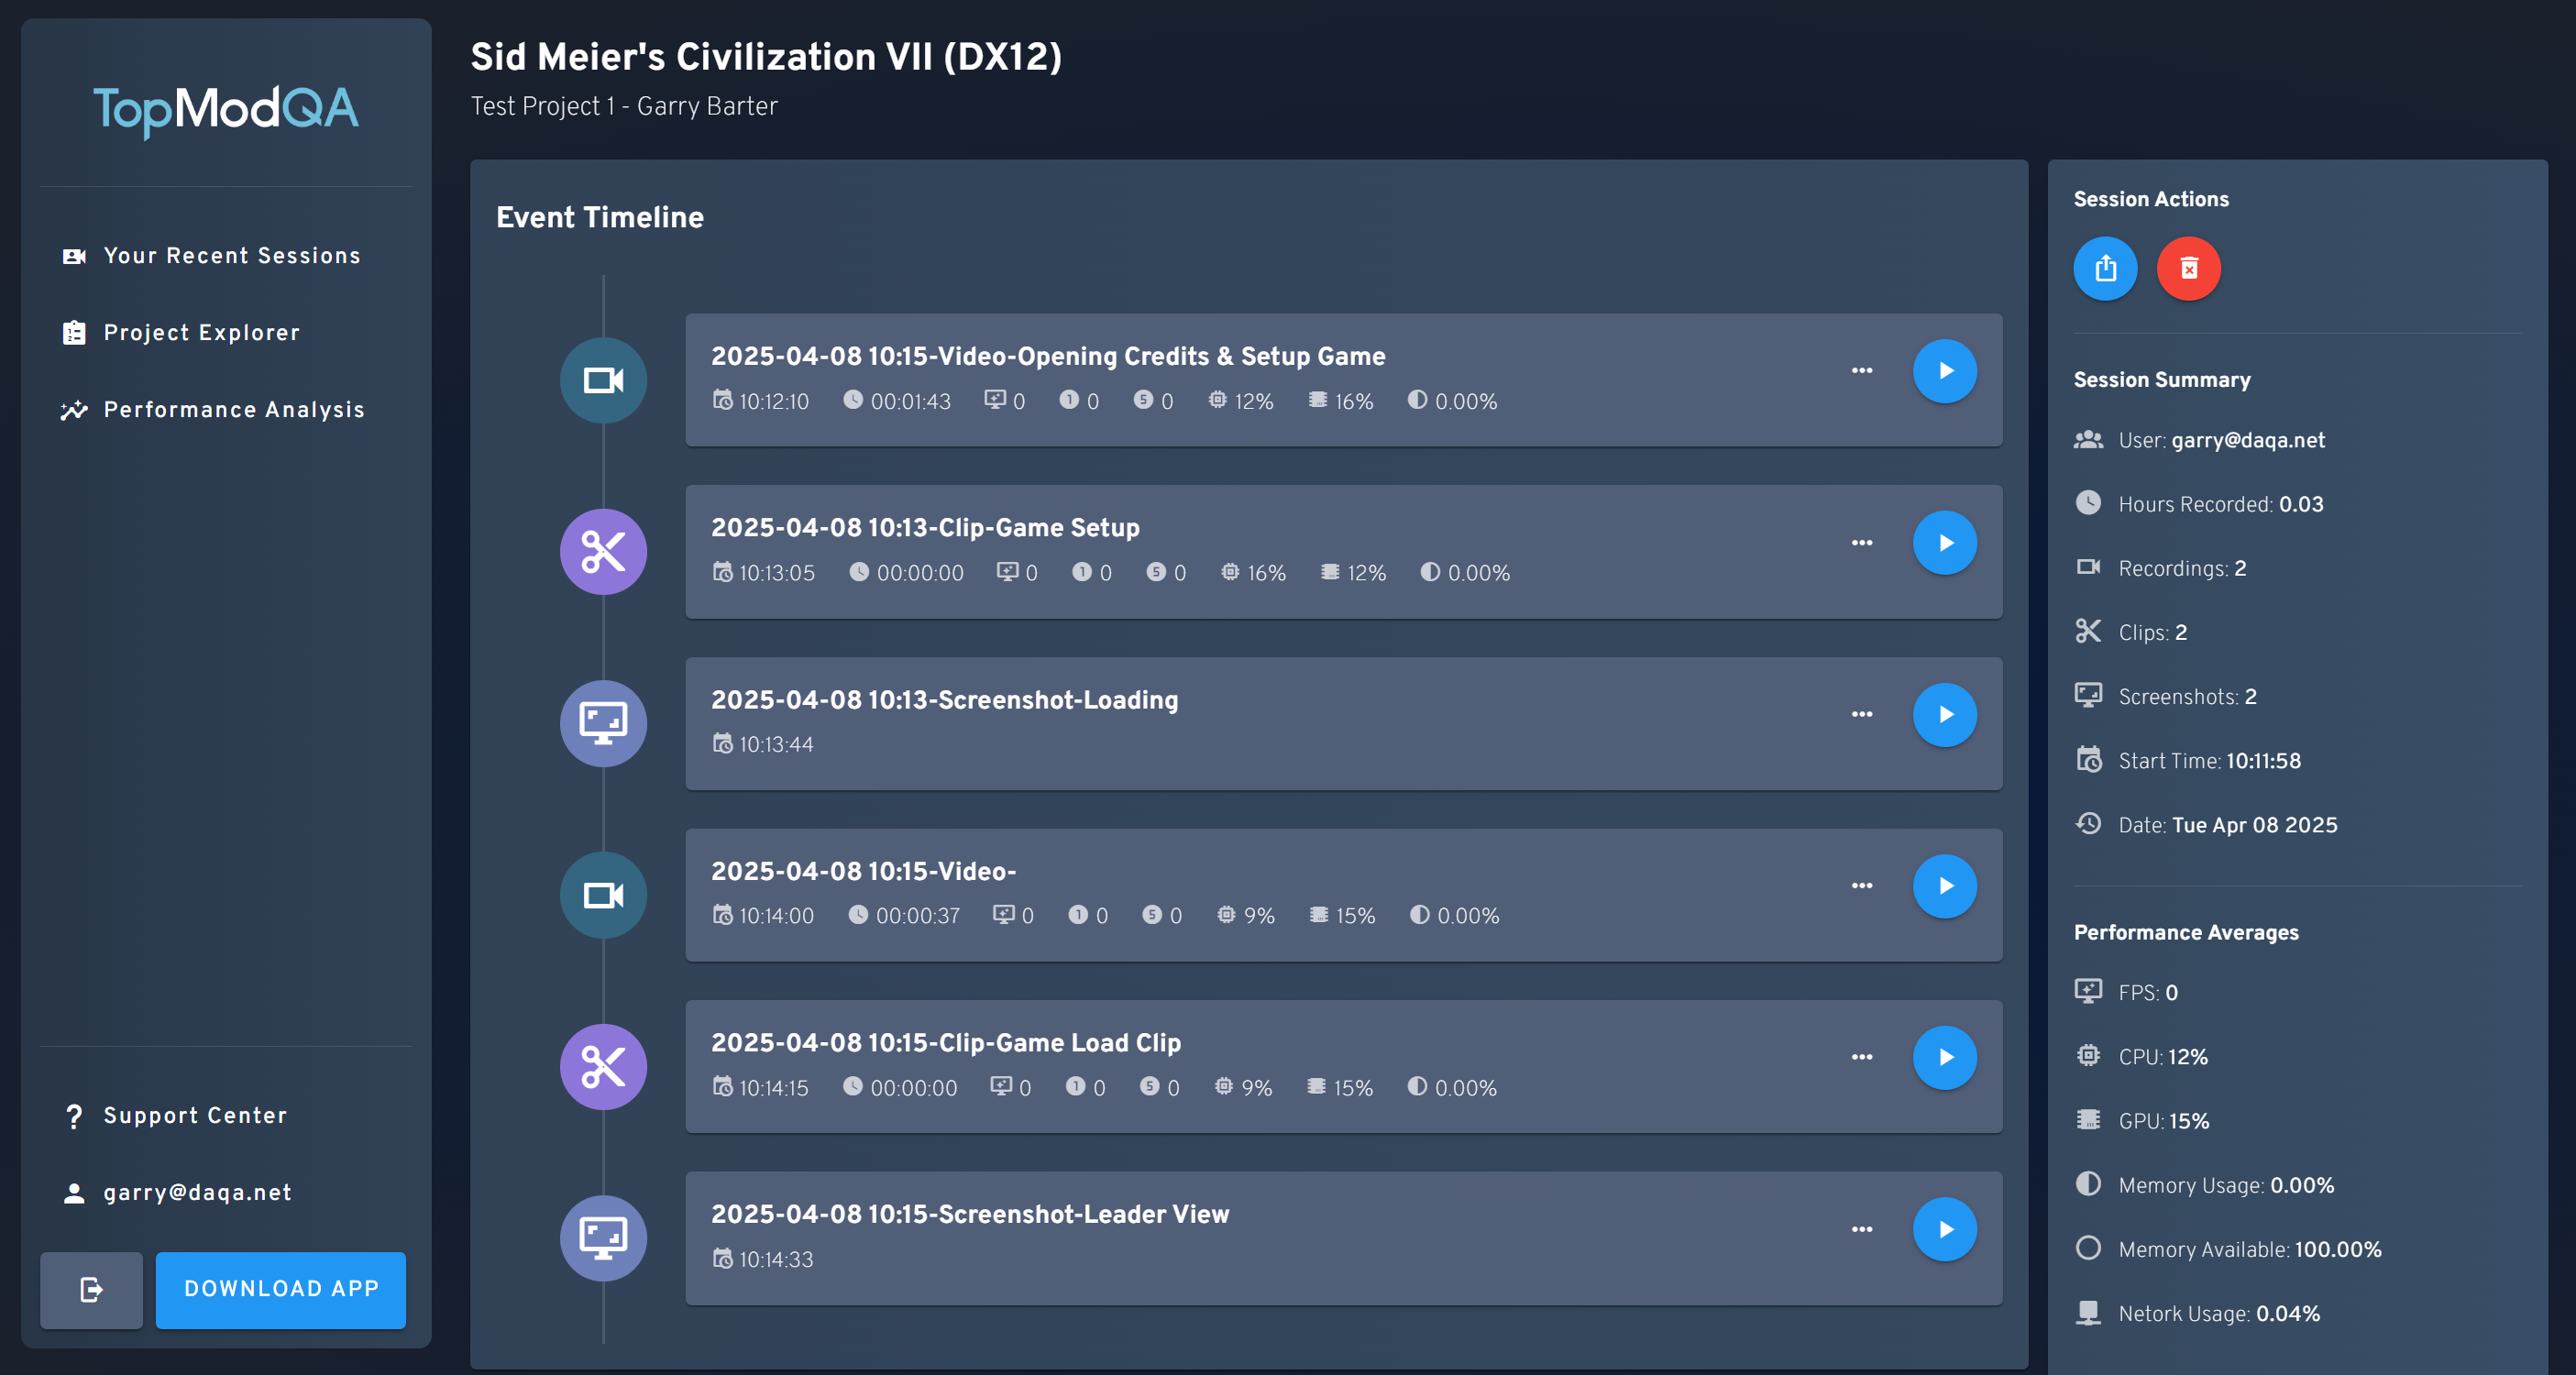
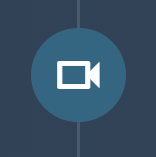
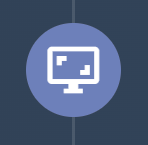
We're going to focus on the Event Timeline in this guide, which is the element in the middle of the page that shows the timeline of Events captured during the Session. Remember, an Event can be a clip or screenshot captured by the tester, or the full recording of the testers test session if they chose to upload that part of the Session. You can tell the type of Event displayed in the timeline by reviewing the icon displayed to the left of the cell. The icons displayed are:
- Camera - Full length recording
- Scissors - A clip the tester wanted to capture
- Screen - A screenshot of the game the tester wanted to upload
If the tester chose to include one, a description of the Event is included as the title for each Event captured. To view one of these Events, click the blue circle with the play icon displayed.
4. View an Event
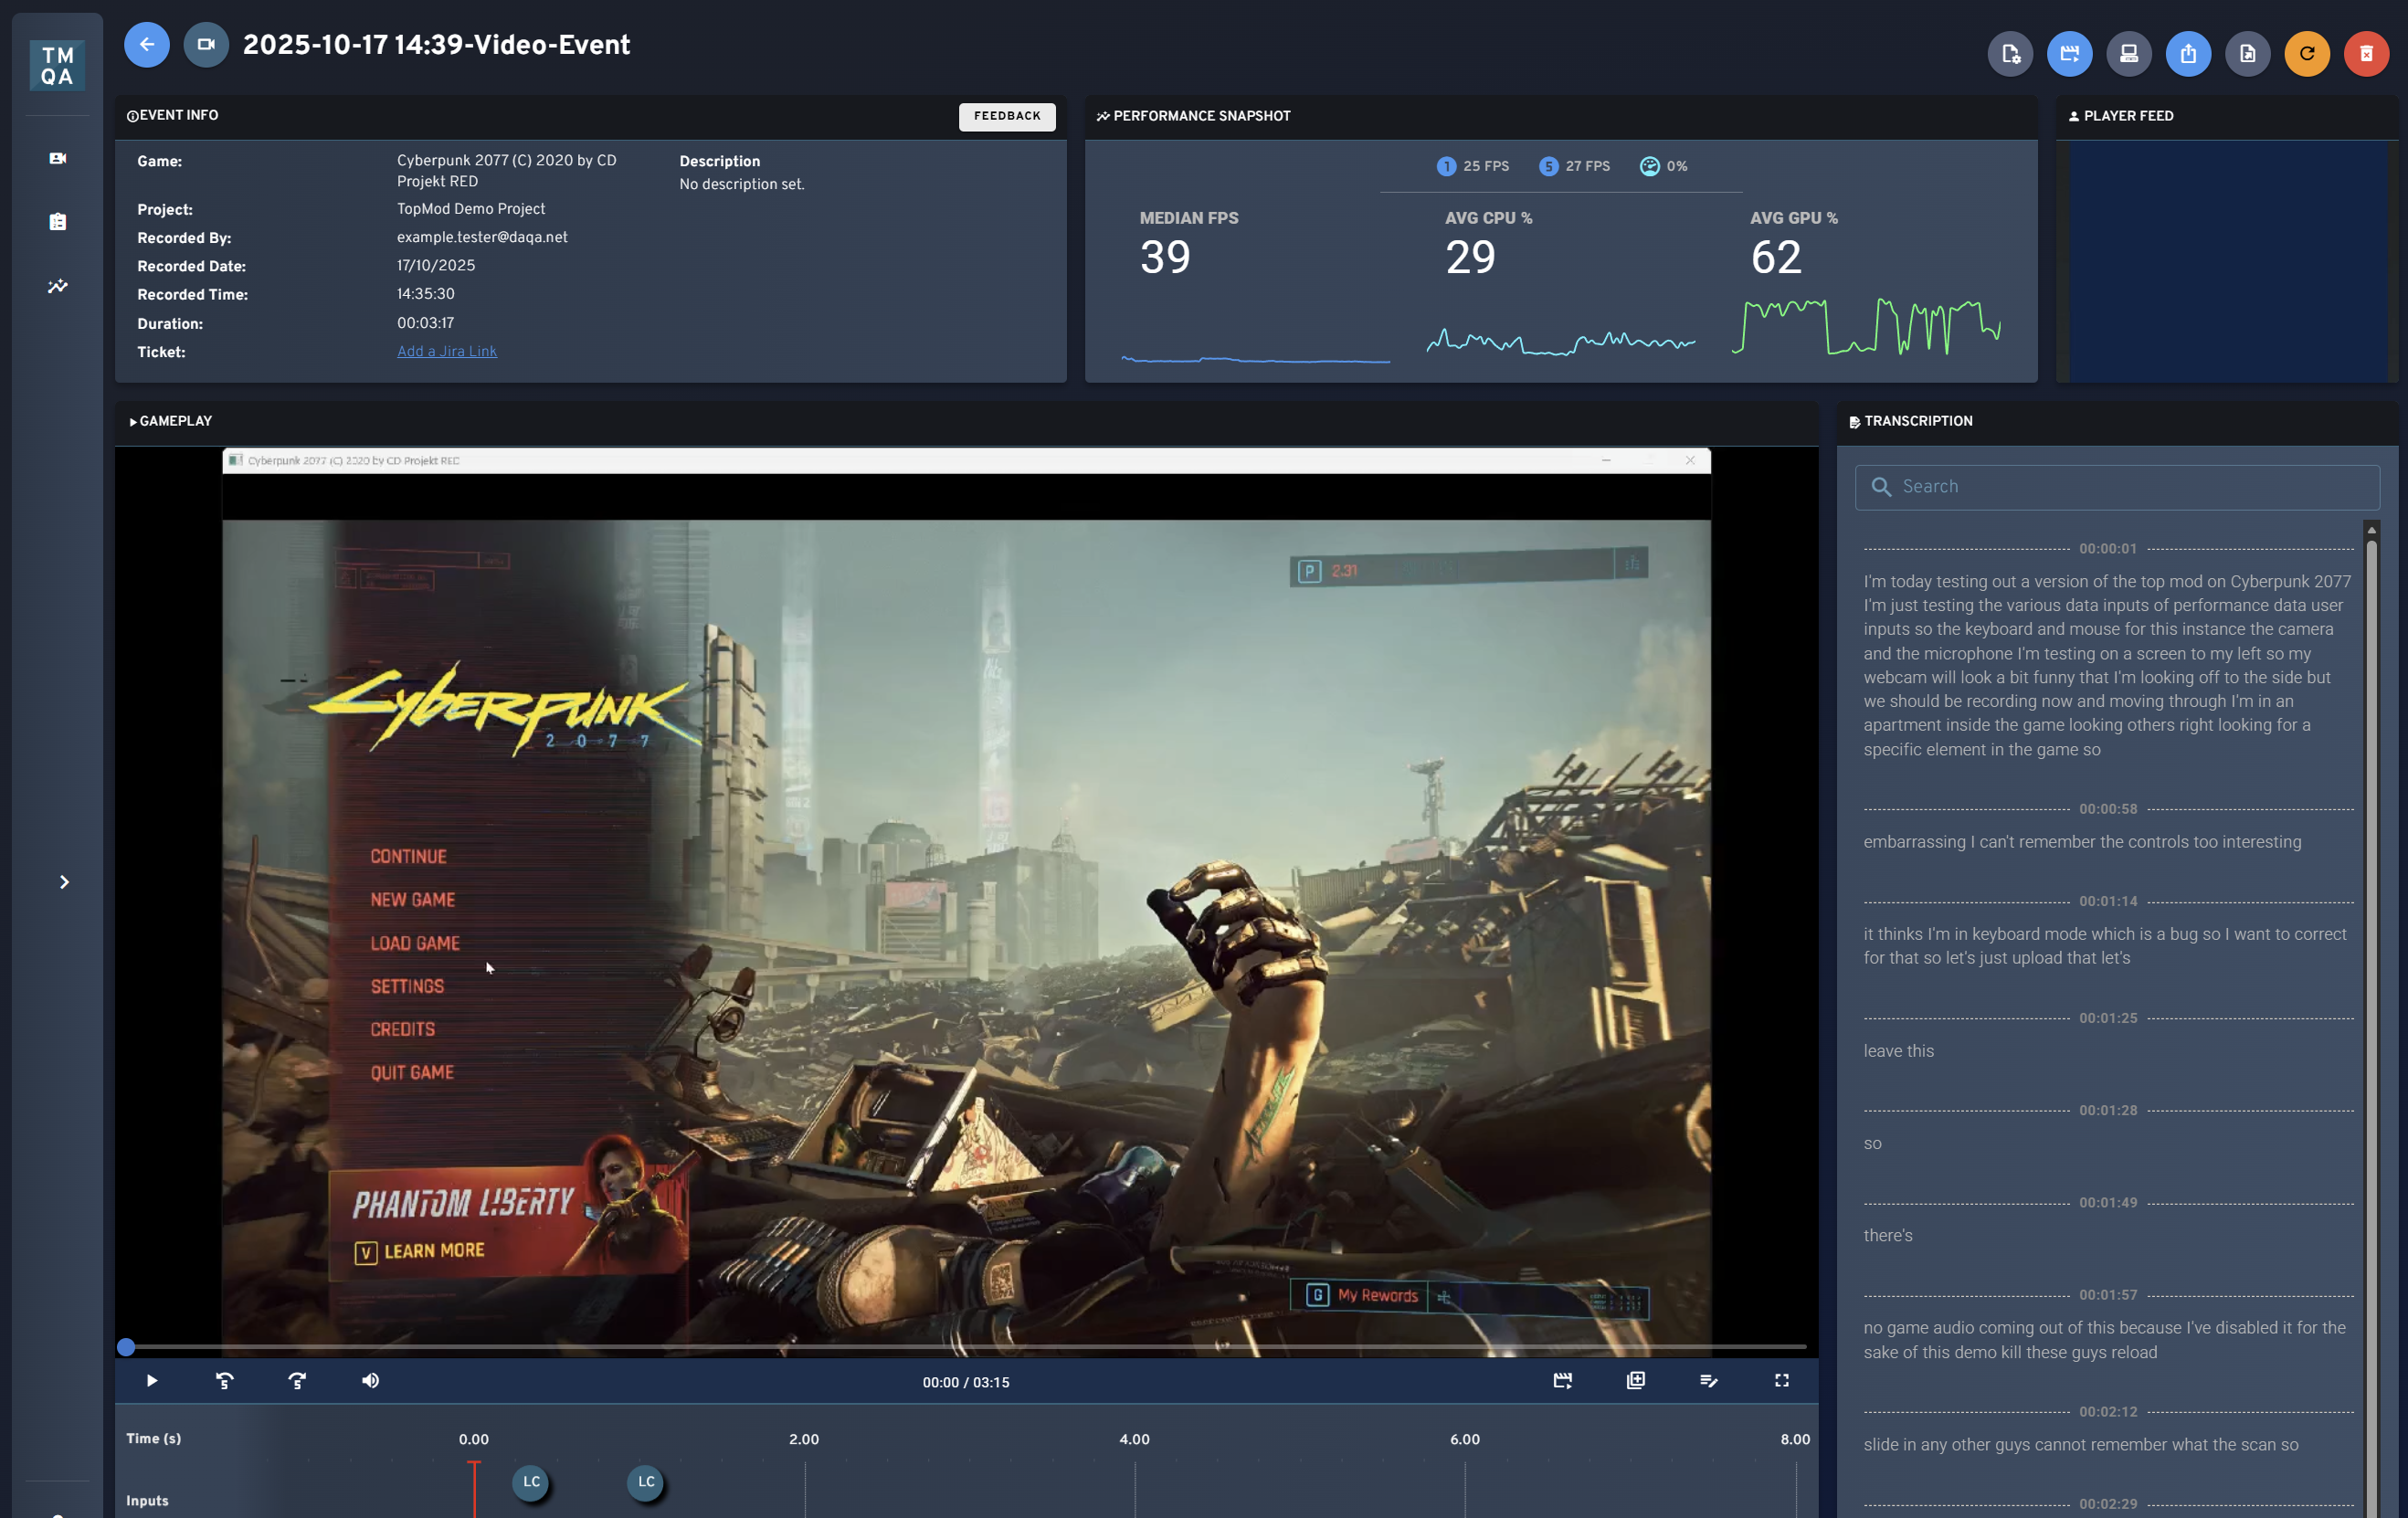
After opening a specific Event, you will be presented with the Event Viewer page. This page displays the content of the Event that was captured including all of the different data points captured by the native recording application.
For screenshots, you will be presented with the raw image captured as part of that Event, for Clips and Recordings, you'll be presented the video footage of the event.
When viewing Clips or Recordings, you'll be presented with various containers including:
- Your main video player - Containing the recorded gameplay footage from your capture. Also features buttons to add voice overlays or edit the layers of audio captured inside the video (great if you want to call something specific out in your bug clip!).
- Event Information - Contains all key meta information about your event and allows you to add a description, tag the type of event captured or link to an external Jira URL.
- Performance Snapshot - As you play through the video capture, this element will update in real time to display the key performance metrics captured by TopMod.
- Player Feed - If you enabled webcam capture as part of your recording, you are able to see the feed of the tester in this container.
- Transcription - A read out of the automated transcription taken from the testers microphone (if enabled during capture). This also contains the ability to edit or skip to specific transcription items by hovering over the text.
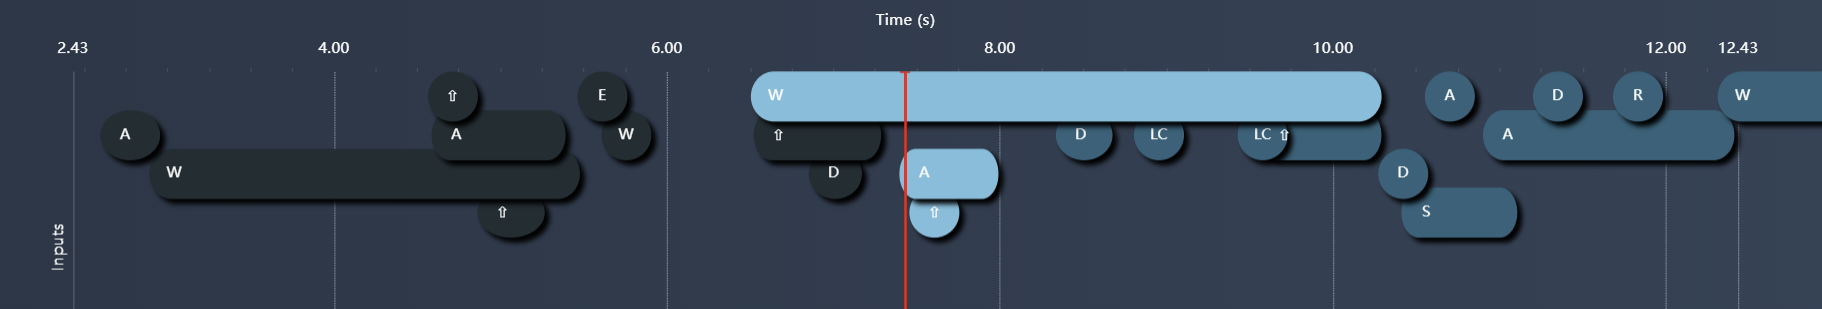
- Input Feed - Below the video player is a timeline of the testers inputs as they play through the game. This displays both keyboard and controller inputs.
- Performance Data Timelines - If you scroll down the page, you will find a full read out of the performance data captured from the session allowing for easy analysis of any peaks or troughs.
5. Sharing With Others
At any time, should you wish to share the Event or Session you are viewing with someone else, you can simply click the "Share Event/Session" button. This is always displayed as a blue circle with the share icon in it as seen below:
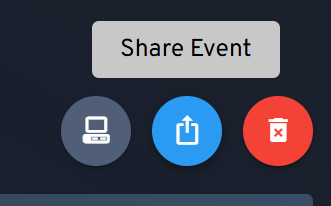
Please note - Any individual with this link can access the Event/Session, they do not require a TopMod QA login to access it so please be careful with sharing this. Any user with this link can access the linked Session but cannot access any other session due to the inclusion of a unique token tied specifically to the Session.
6. Finding Other Sessions In a Project
Once you are finished reviewing your selected Event, you may wish to review other Sessions from a Project. This is all possible within the TopMod QA dashboard. To start this process, select the "Project Explorer" from the left hand sidebar.
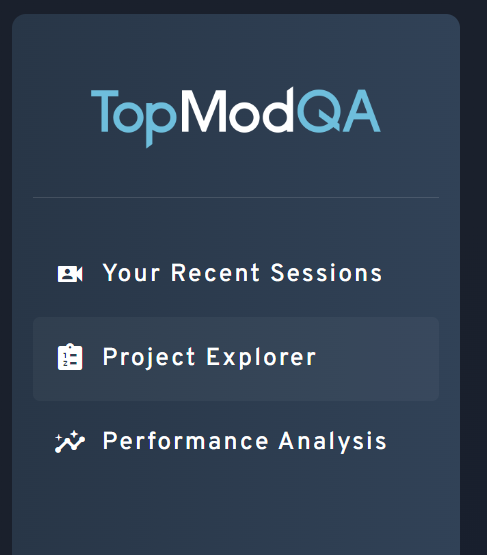
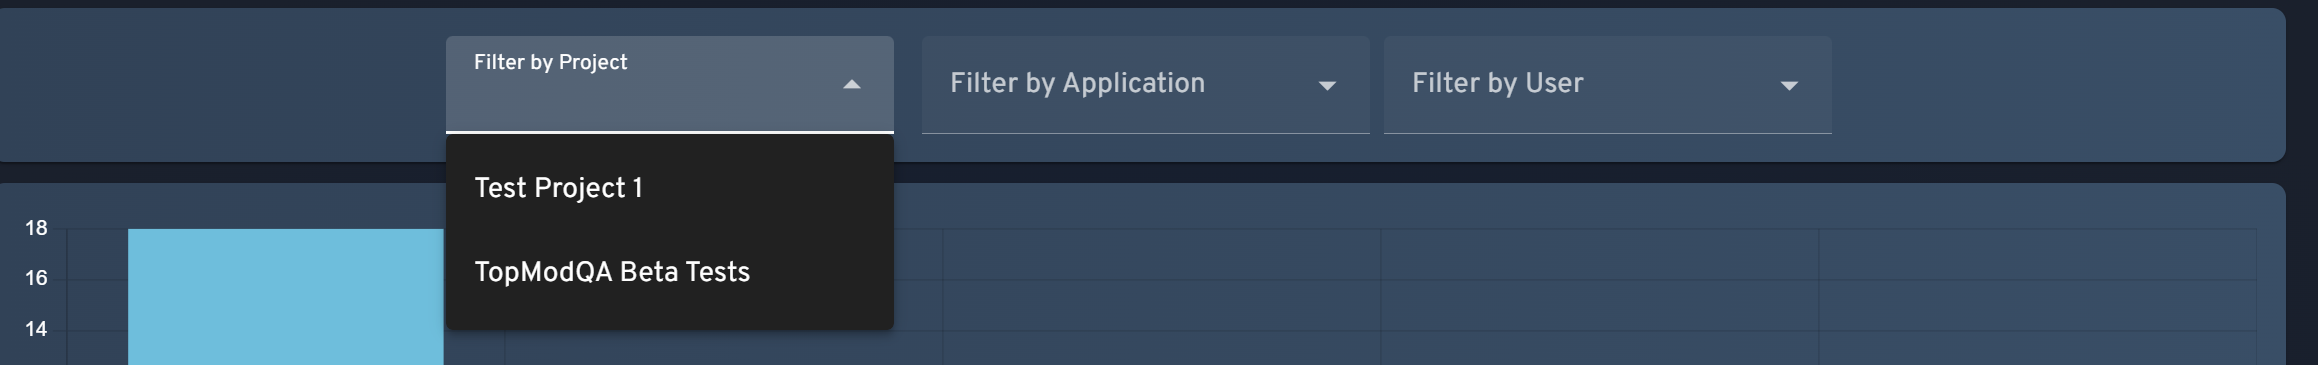
This will load the Project Explorer page which houses Sessions from all Projects you have access to. You'll be able to see different users contributing to the projects by reviewing the Session list and looking specifically at the "User" column.

As with the "Your Recent Sessions" page we saw previously, you can filter this list by Project, Application and User by using the filters at the top of the page. Selecting any value in here will update the Session List below the chart.
You can then select any Session you wish to review more by clicking on the blue circle button to open the Session View page for that specific session.
And that's it! That's all you need to do to start getting the most out of TopMod QA's new dashboard. To continue with the First Time User Guides, click here to learn about managing a Workspace.
Feature Announcements
A section dedicated to the latest announcements from TopMod QA
Live UI - Feature Announcement
We’re excited to announce the launch of TopMod QA’s Live UI, a major upgrade that redefines how testers and developers review bugs. Live UI streamlines the capture process and delivers deeper context around each issue—making it faster and easier than ever to move from bug discovery to resolution.
This article is going to cover the changes we’ve made and how those changes benefit you. We’ve also recorded a video showcasing the Live UI feature in further detail. Please click below to watch.
Optimized Workflow
At its core, Live UI replaces the older Composite Video format with a clean, interactive webpage that brings all captured data together in one place.
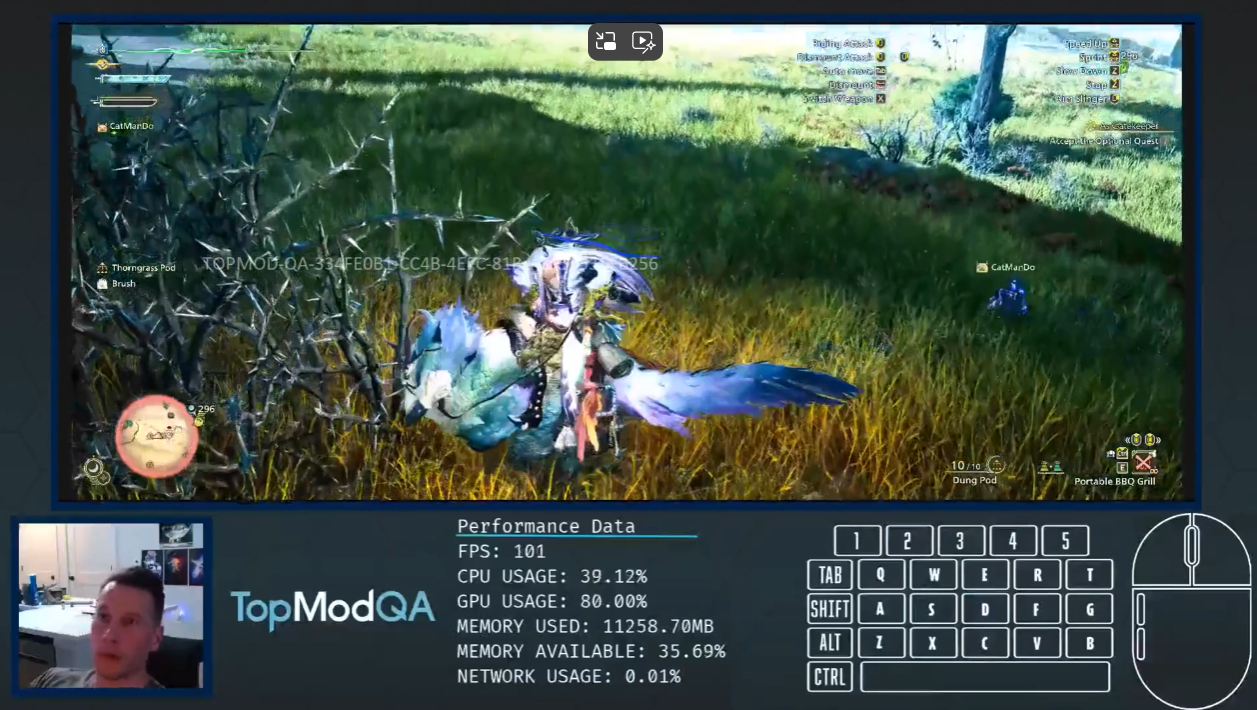
The above image shows an example of our older TopMod QA Composite videos. These videos present all of the different data points captured by our Native Recording application in one single video file.
One of the major challenges with using these videos is that they require significant post-processing after the bug has been captured to generate the footage ready for sharing. This creates additional time in the capture process and means testers can be left waiting for their bug to process before being able to add to a ticket.
With Live UI, the time from capture to share drops by 60–80%. As soon as TopMod QA uploads the footage, the bug is ready to share—no waiting, no extra processing.
This process is further optimized when utilizing our share link functionality which removes the need to download/upload video footage. Remember, using a share link to link to the bug removes the need for the developer to login, they simply click the share link attached in Jira (or any other product management tool) and they are presented the webpage hosting the bug.
Increased Gameplay Visibility
One of the most consistent pieces of feedback we’ve encountered since launching the dashboard a few months ago has been around the users ability to view the gameplay being captured. In Composite Videos, gameplay was often squeezed into a smaller window, making it harder to see critical details.
With the introduction of the Live UI, this issue has been removed. Live UI puts gameplay front and centre. Testers and developers can view it clearly within the dashboard or expand to full-screen whenever needed.
We believe the balance of the Live UI gives users full visibility of the gameplay whilst also keeping access to the additional data being captured in the testers environment.
Improved Bug Context
Finally, one of the most powerful aspects of the Live UI feature is the depth of presentation we can now provide for all of the data points we capture during the testers session. Composite Videos locked data to specific moments in playback, making it difficult to see how issues unfolded over time.
From a bug-fixing perspective, that can make diagnosing a bug difficult and limits the value of the additional data being captured. With Live UI, every captured datapoint is now fully interactive and time-aware. The new User Timeline widget shows exactly which inputs—keyboard, mouse, or controller—were triggered throughout the bug’s lifecycle, giving developers the context they need to diagnose issues faster and more accurately.
Looking Ahead
Whilst the Composite video remains part of the TopMod QA experience, we believe the introduction of the Live UI opens up more pathways for innovation in the future and will allow us to further improve the bug capture process. We look forward to sharing more news on these advancements in the coming weeks and months.
This feature is now live for all users and we'd love to hear your feedback.
First Time User Guide: Managing Your Workspace
As part of our latest update (Changelog - TopMod), we have made a number of changes to the way Managers manage their teams Workspace. A Workspace is a collection of your teams users and the Projects they can upload bug footage into.
This article provides a guide on how to use this Workspace Management area to perform two key interactions. Firstly, adding new users to your Workspace, and second, setting up Projects for your users to upload to.
Adding Users To Your Workspace
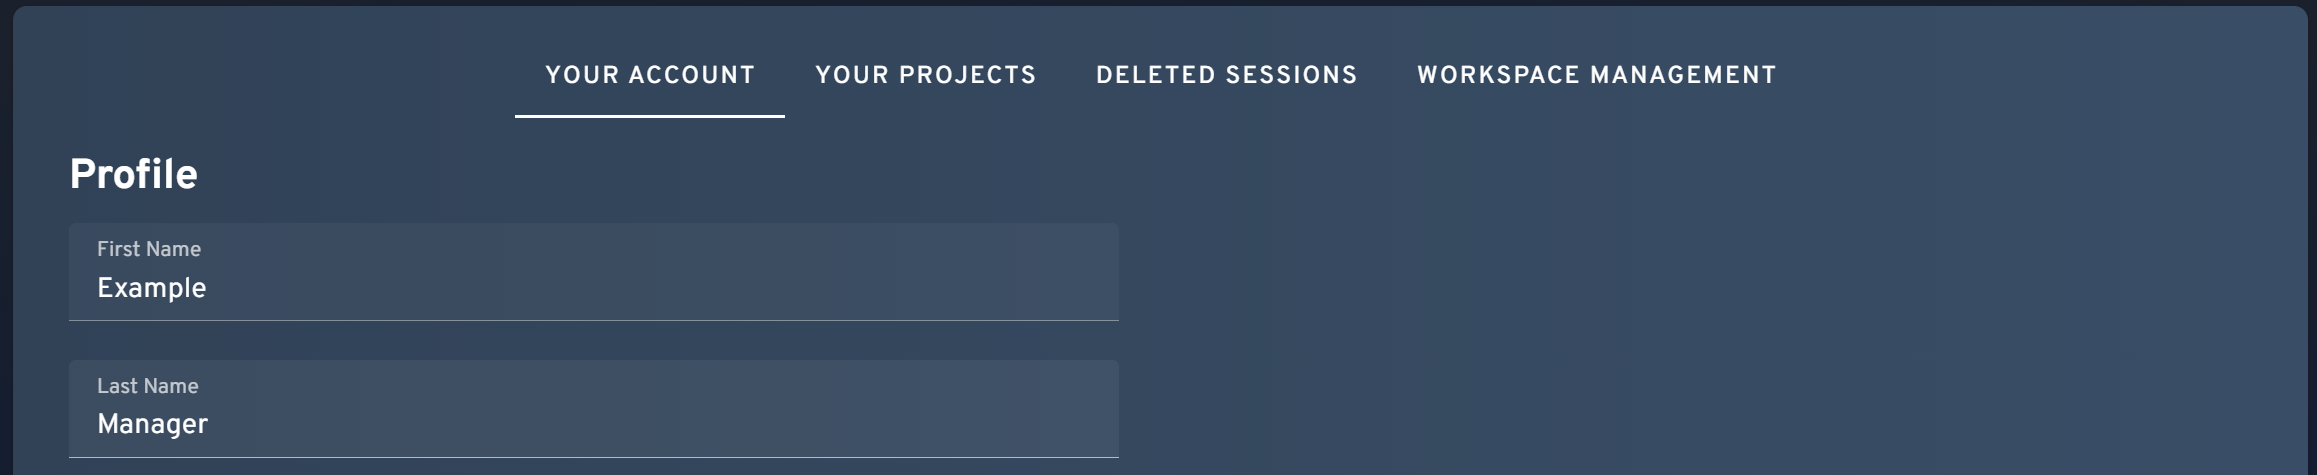
1. Navigate to the Settings Page
To start this process, login to the TopMod QA dashboard and navigate to your Settings page by either visiting http://app.topmodqa.com/settings or by clicking on the Settings icon in the sidebar navigation.
2. Select Workspace Management
With the Settings page opened, navigate to the "Workspace Management" tab. Please note, if you do not see the Workspace Management tab then you may not have the required permissions as this section is only available to Managers & Admins.
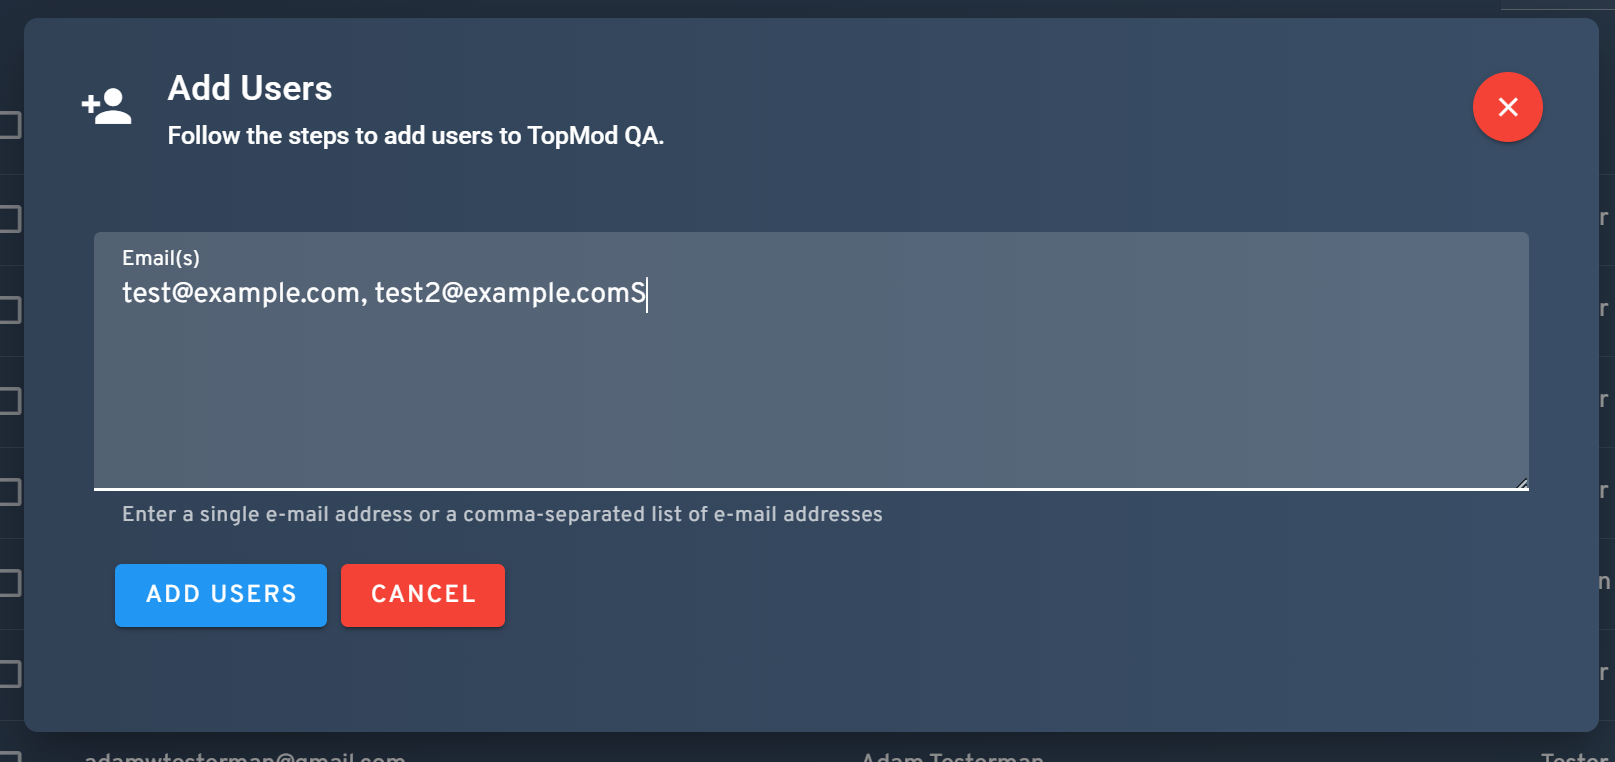
3. Click "Add Users" Button
Once the Workspace Management tab has been selected, you should be presented with two tables. The first is the Workspace User Management table. In this section, you'll find a blue "Add Users" button. Clicking this will open a modal that allows you to add new users to the Workspace.
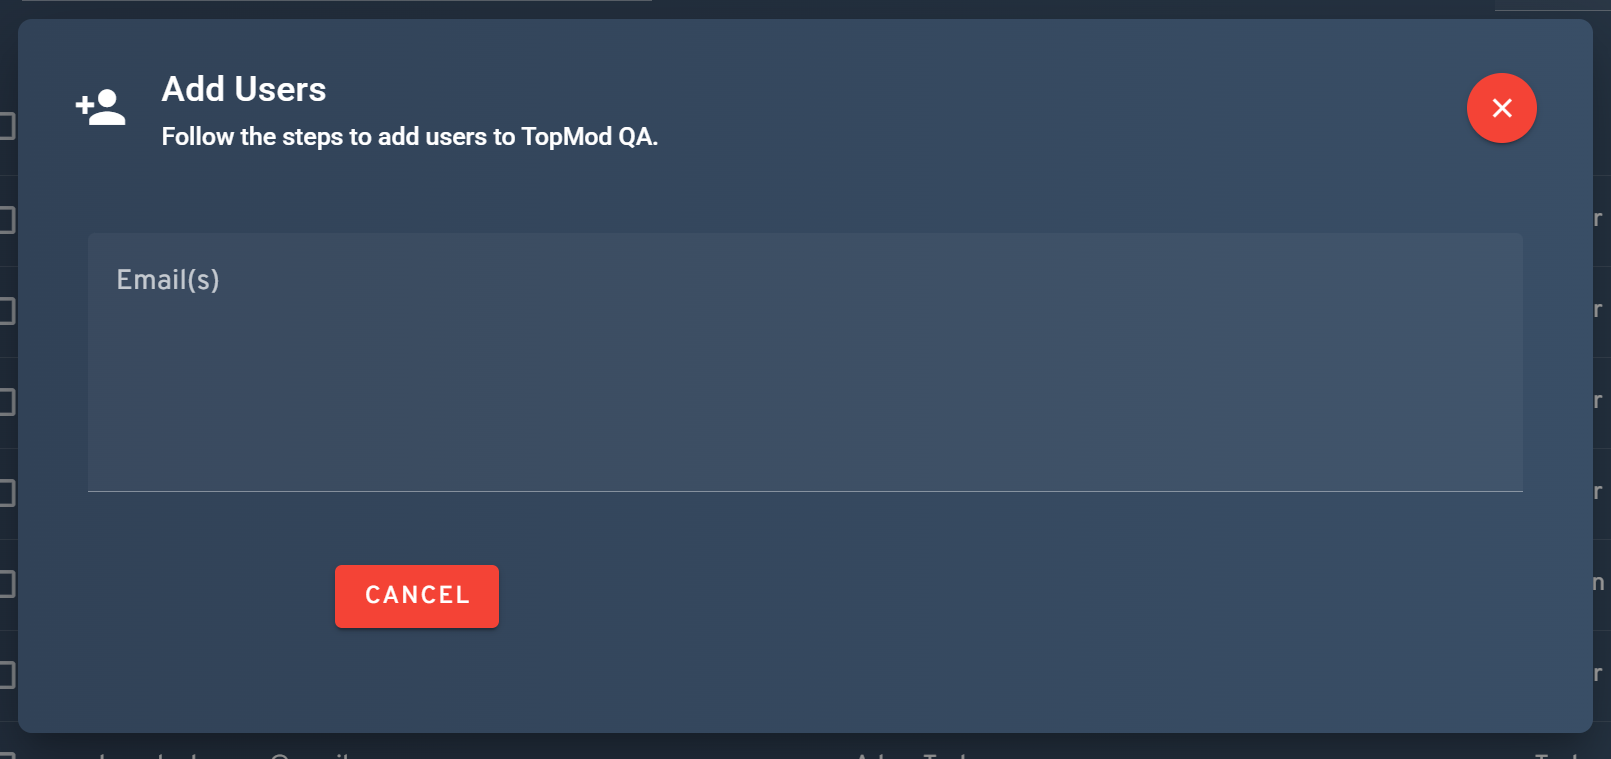
4. Enter Email Addresses for New Users
From here, enter in the email addresses for all users you'd like to add to this Workspace and click "Add Users" to confirm. Upon clicking "Add Users", all new TopMod QA users will be sent an invite email and be prompted to create a TopMod QA account.
Please note, to enter more than one user at a time, add a comma between email addresses.
Creating Your First Project
1. Navigate to the Settings page
To start this process, login to the TopMod QA dashboard and navigate to your Settings page by either visiting http://app.topmodqa.com/settings or by clicking on the Settings icon in the sidebar navigation.
2. Select Workspace Management
With the Settings page opened, navigate to the "Workspace Management" tab. Please note, if you do not see the Workspace Management tab then you may not have the required permissions as this section is only available to Managers & Admins.
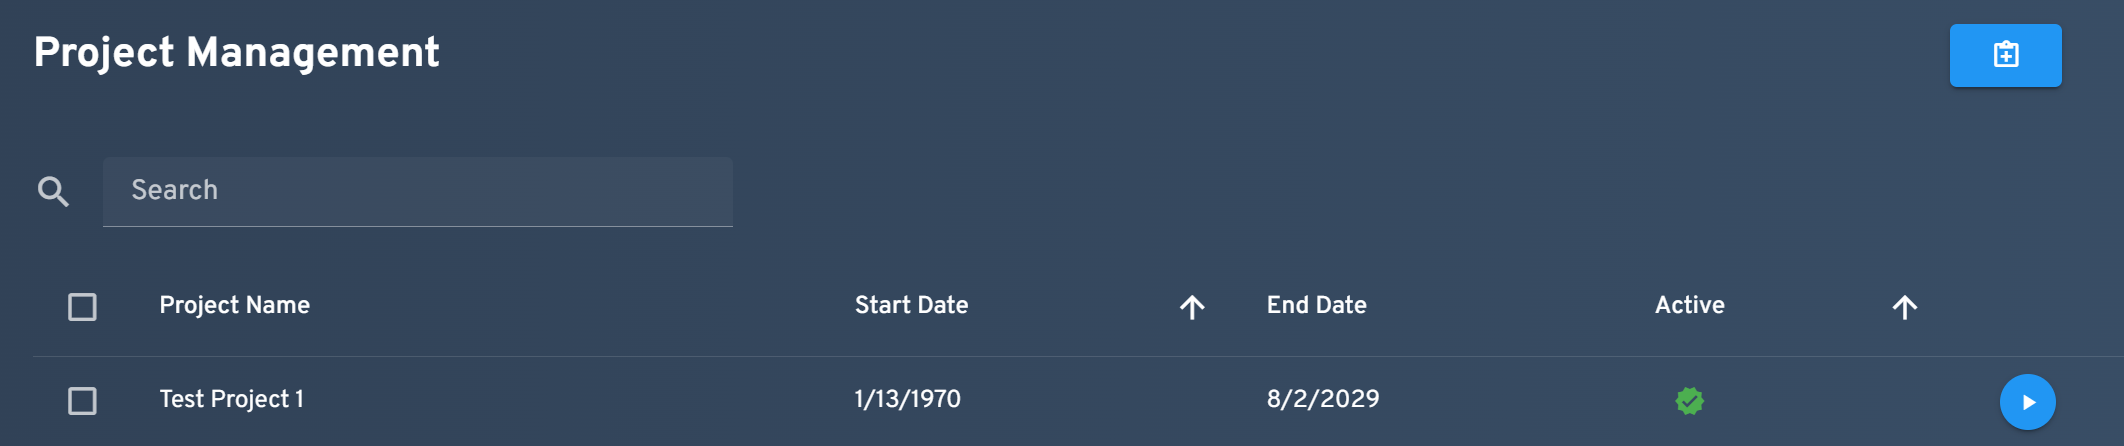
3. Open "Create Project" Wizard
Within the Workspace Management tab, you'll find two key sections, User Management & Project Management. To create a Project, scroll to the Project Management section and click the "Create Project" button on the far right of the section.
4. Add Project Details
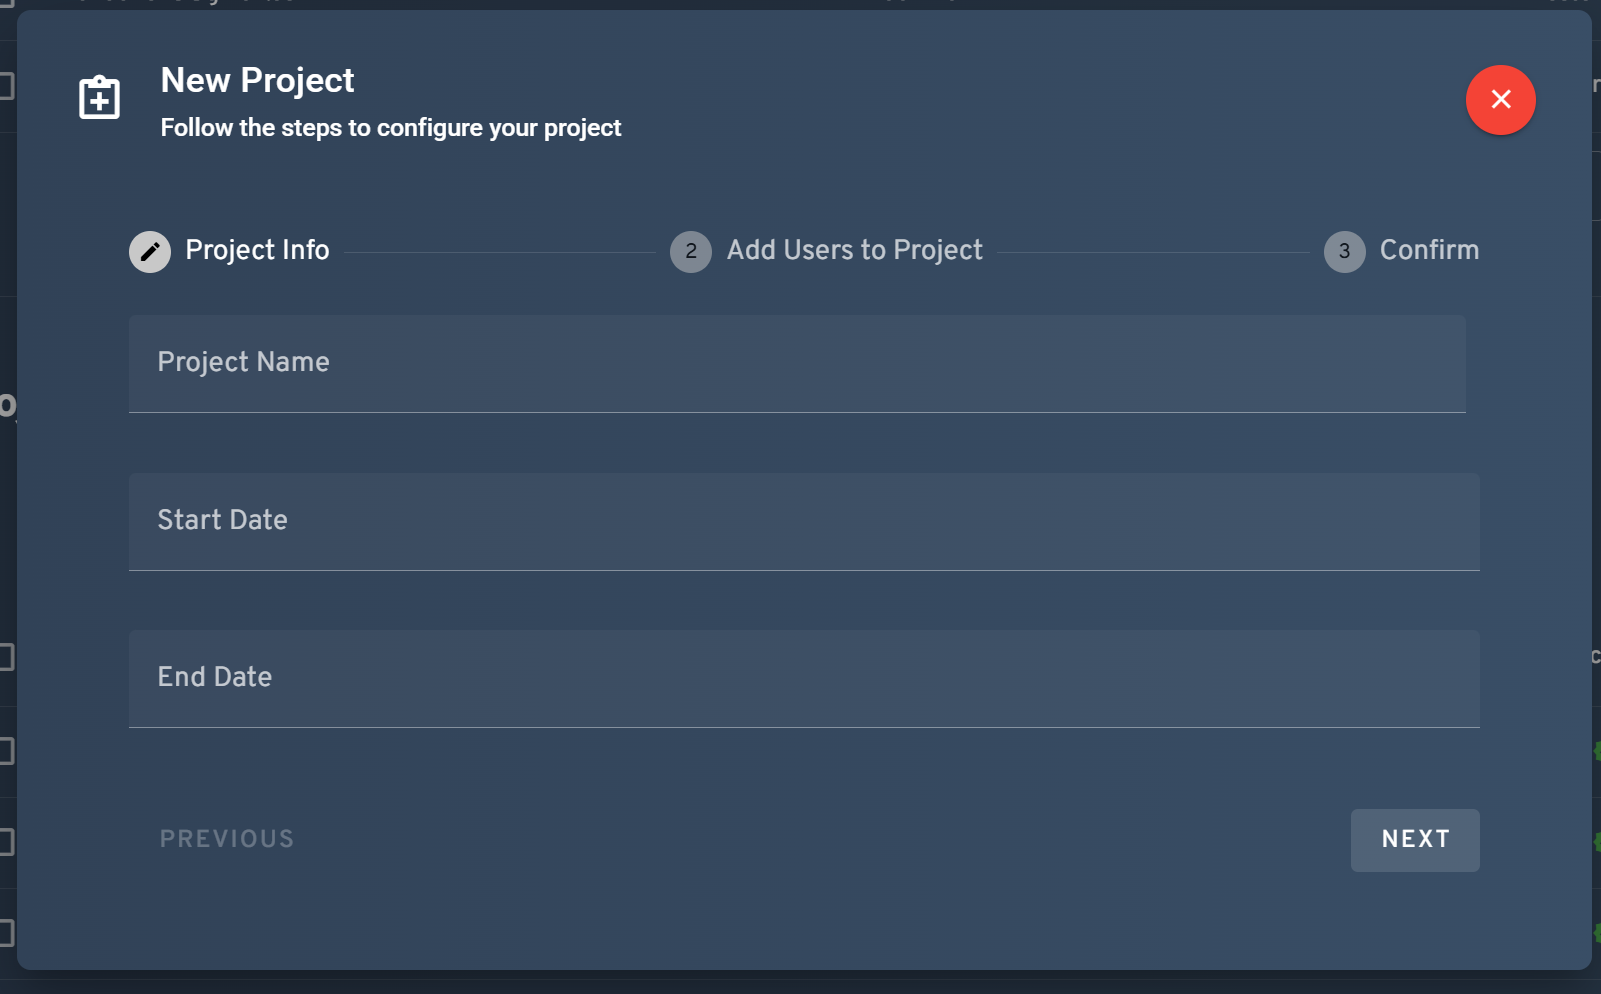
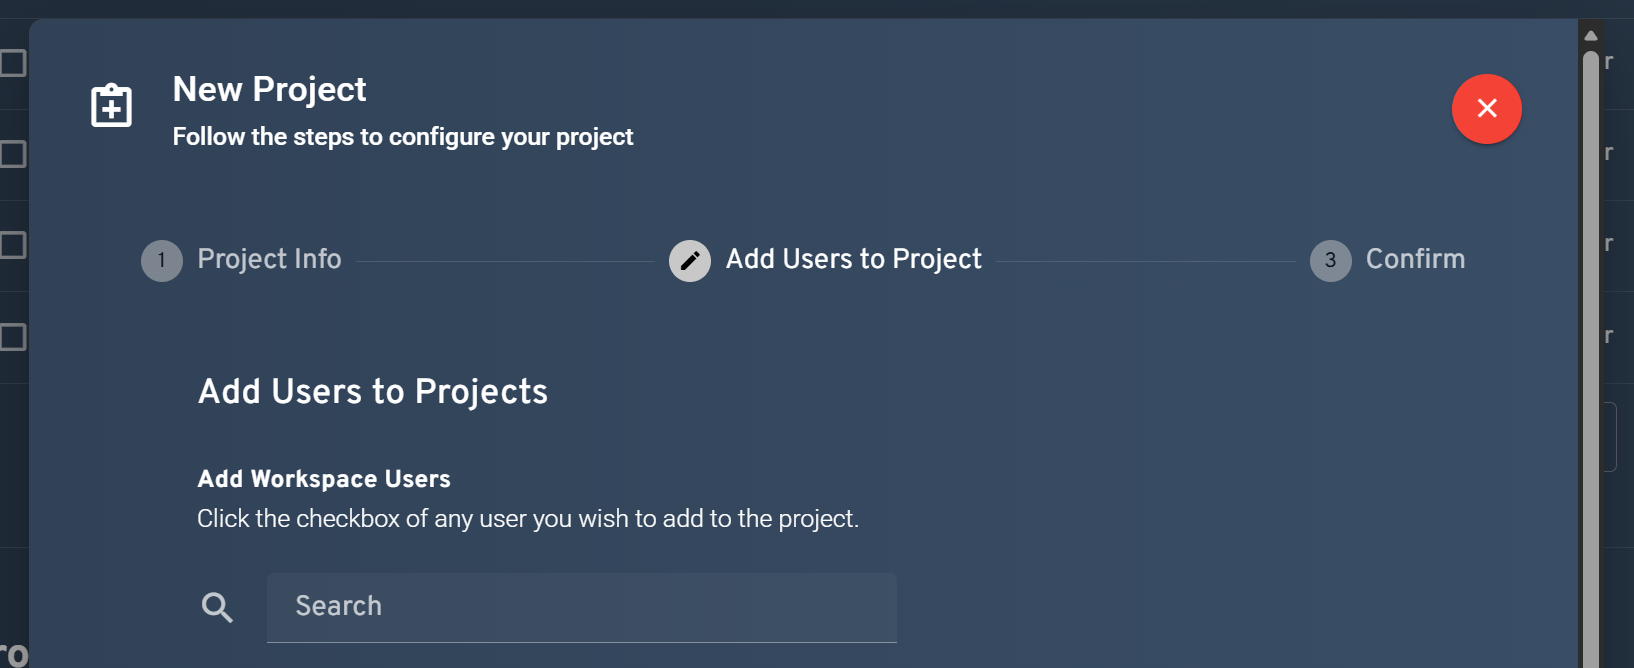
5. Add Users to Project
After inputting your new Projects details, clicking the "Next" button will take you to the "Add Users to Project" stage. In this area, you'll be presented with all of your Workspace's users to select from. Click on as many of the Users select boxes as required and then click the next button to proceed to the final stage of the wizard.
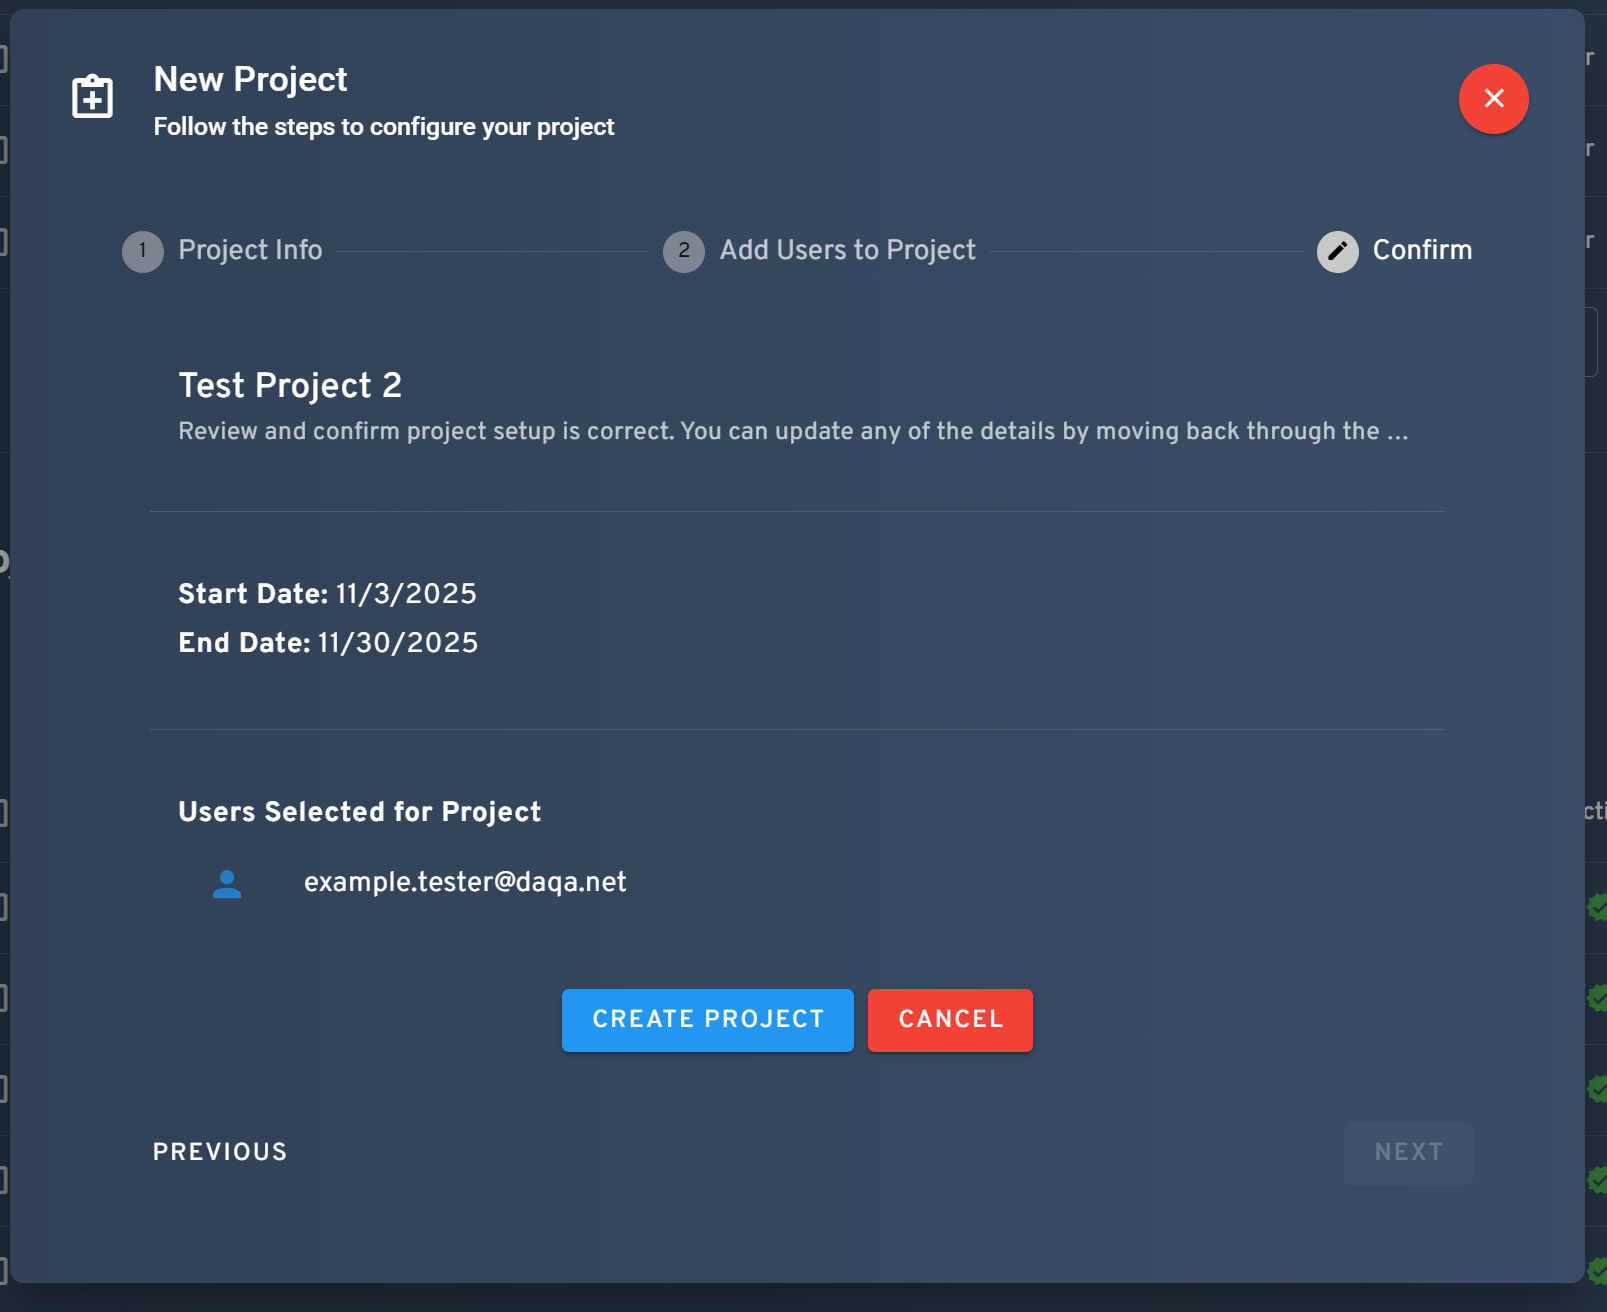
6. Confirmation
After adding specific users to your Project, you'll be presented with a summary of the new Project being presented. If everything looks correct, click the "Create Project" button to complete the wizard and add the Project to your Workspace.