Getting Started with the Dashboard
As outlined in our latest release announcement, TopMod QA's version 2.2 release includes the launch of the TopMod QA dashboard. The dashboard's aim is to become the natural extension of the native recording application, a place to go to review and share the footage being captured within the application.
To help you get started with this new part of TopMod QA, we have created the following guide. Should you find it easier, we've also recorded a walkthrough of the following areas in the video below:
Getting Started Tutorial
1. Login
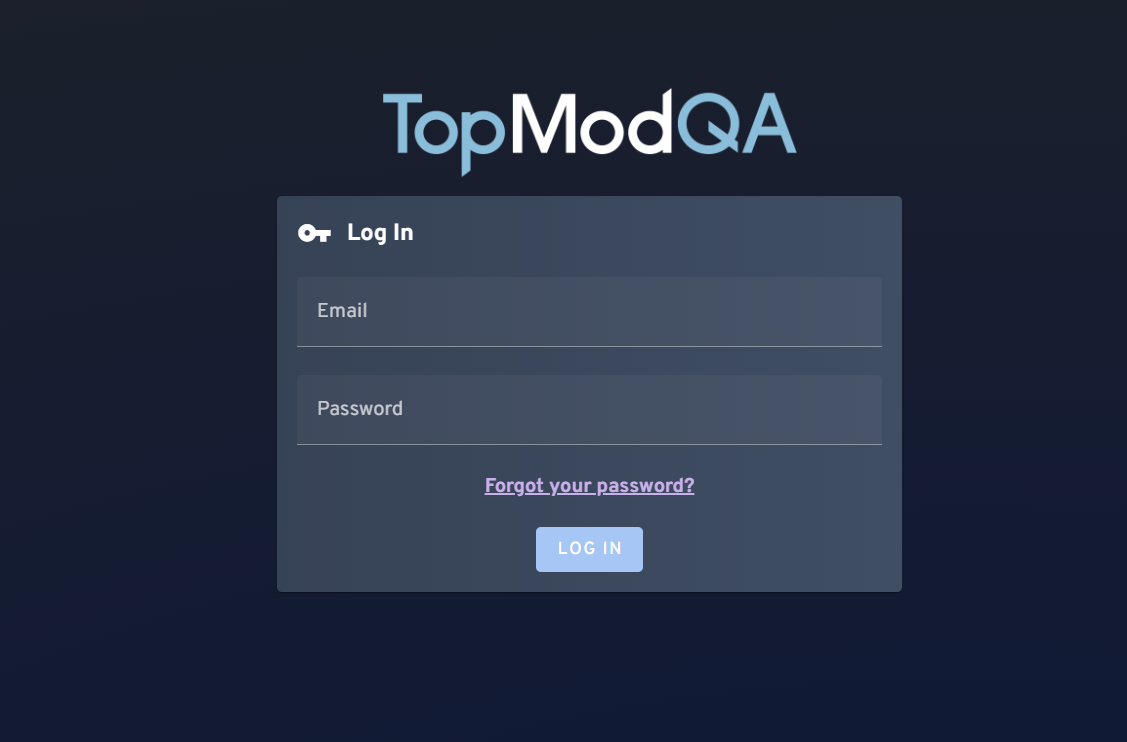
To login to TopMod QA, head to https://app.topmodqa.com/ and enter the login details provided to you previously. If you do not remember your password, click on the "Forgot Your Password?" link or click here: https://app.topmodqa.com/auth-management. Please note, you must have access to the email address associated to your account to receive the forgotten password email.
2. Finding a Session
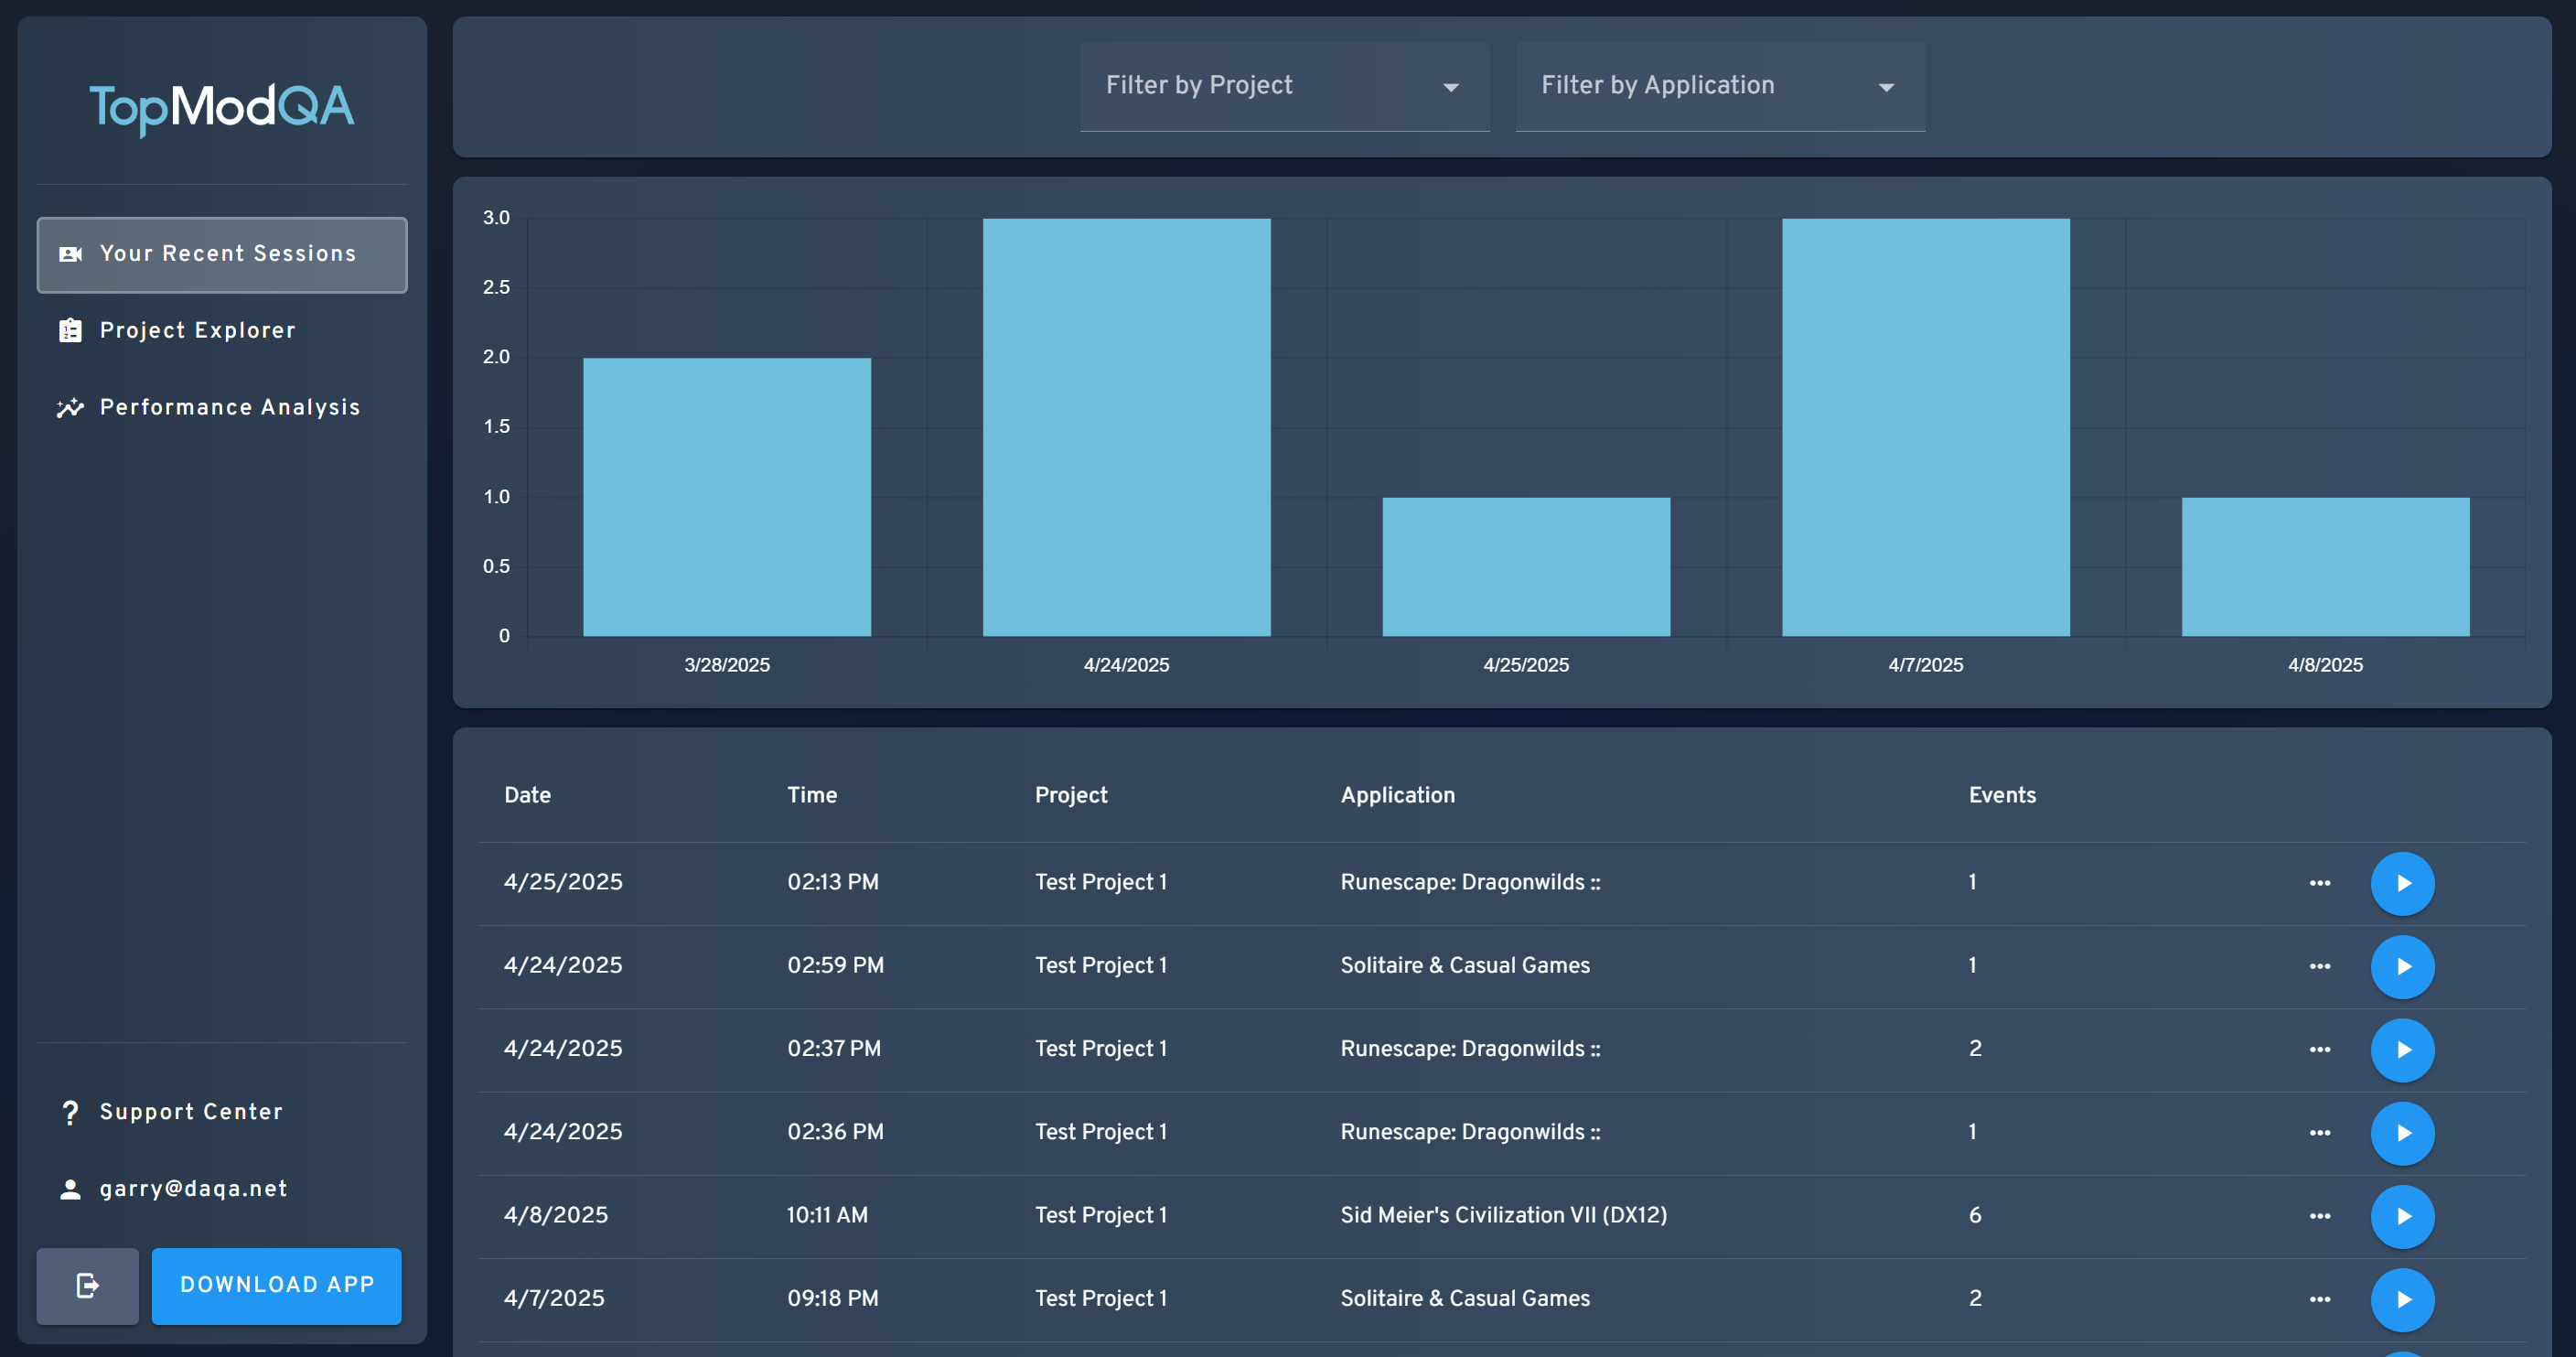
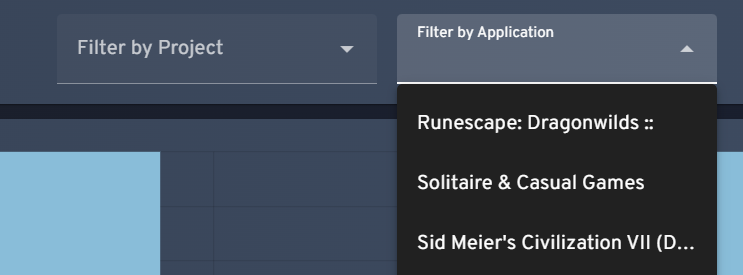
Once logged in, you'll be directed to "Your Recent Sessions" page. This page displays all of your uploaded Sessions, arranged chronologically with your most recent Session displayed at the top of the list. If you would like to find a Session associated to a specific Project or Application, you can do so using the dropdown menus at the top of the page.
Once you have found the Session you'd like to view, click the blue circle with the play icon in to open the Session for further review.
If you are unfamiliar with how TopMod QA manages Sessions and Events within, we have created a short explainer video which can be found here: Introducing Sessions &... | TopMod QA Docs
3. Review a Session
Upon opening your selected Session, you'll be presented with our Session View page. This page includes some key information including:
- The Session information including the email of the tester who uploaded the Session, number of events and the amount of hours recorded in the session.
- The Performance averages across each event captured
- The Event Timeline
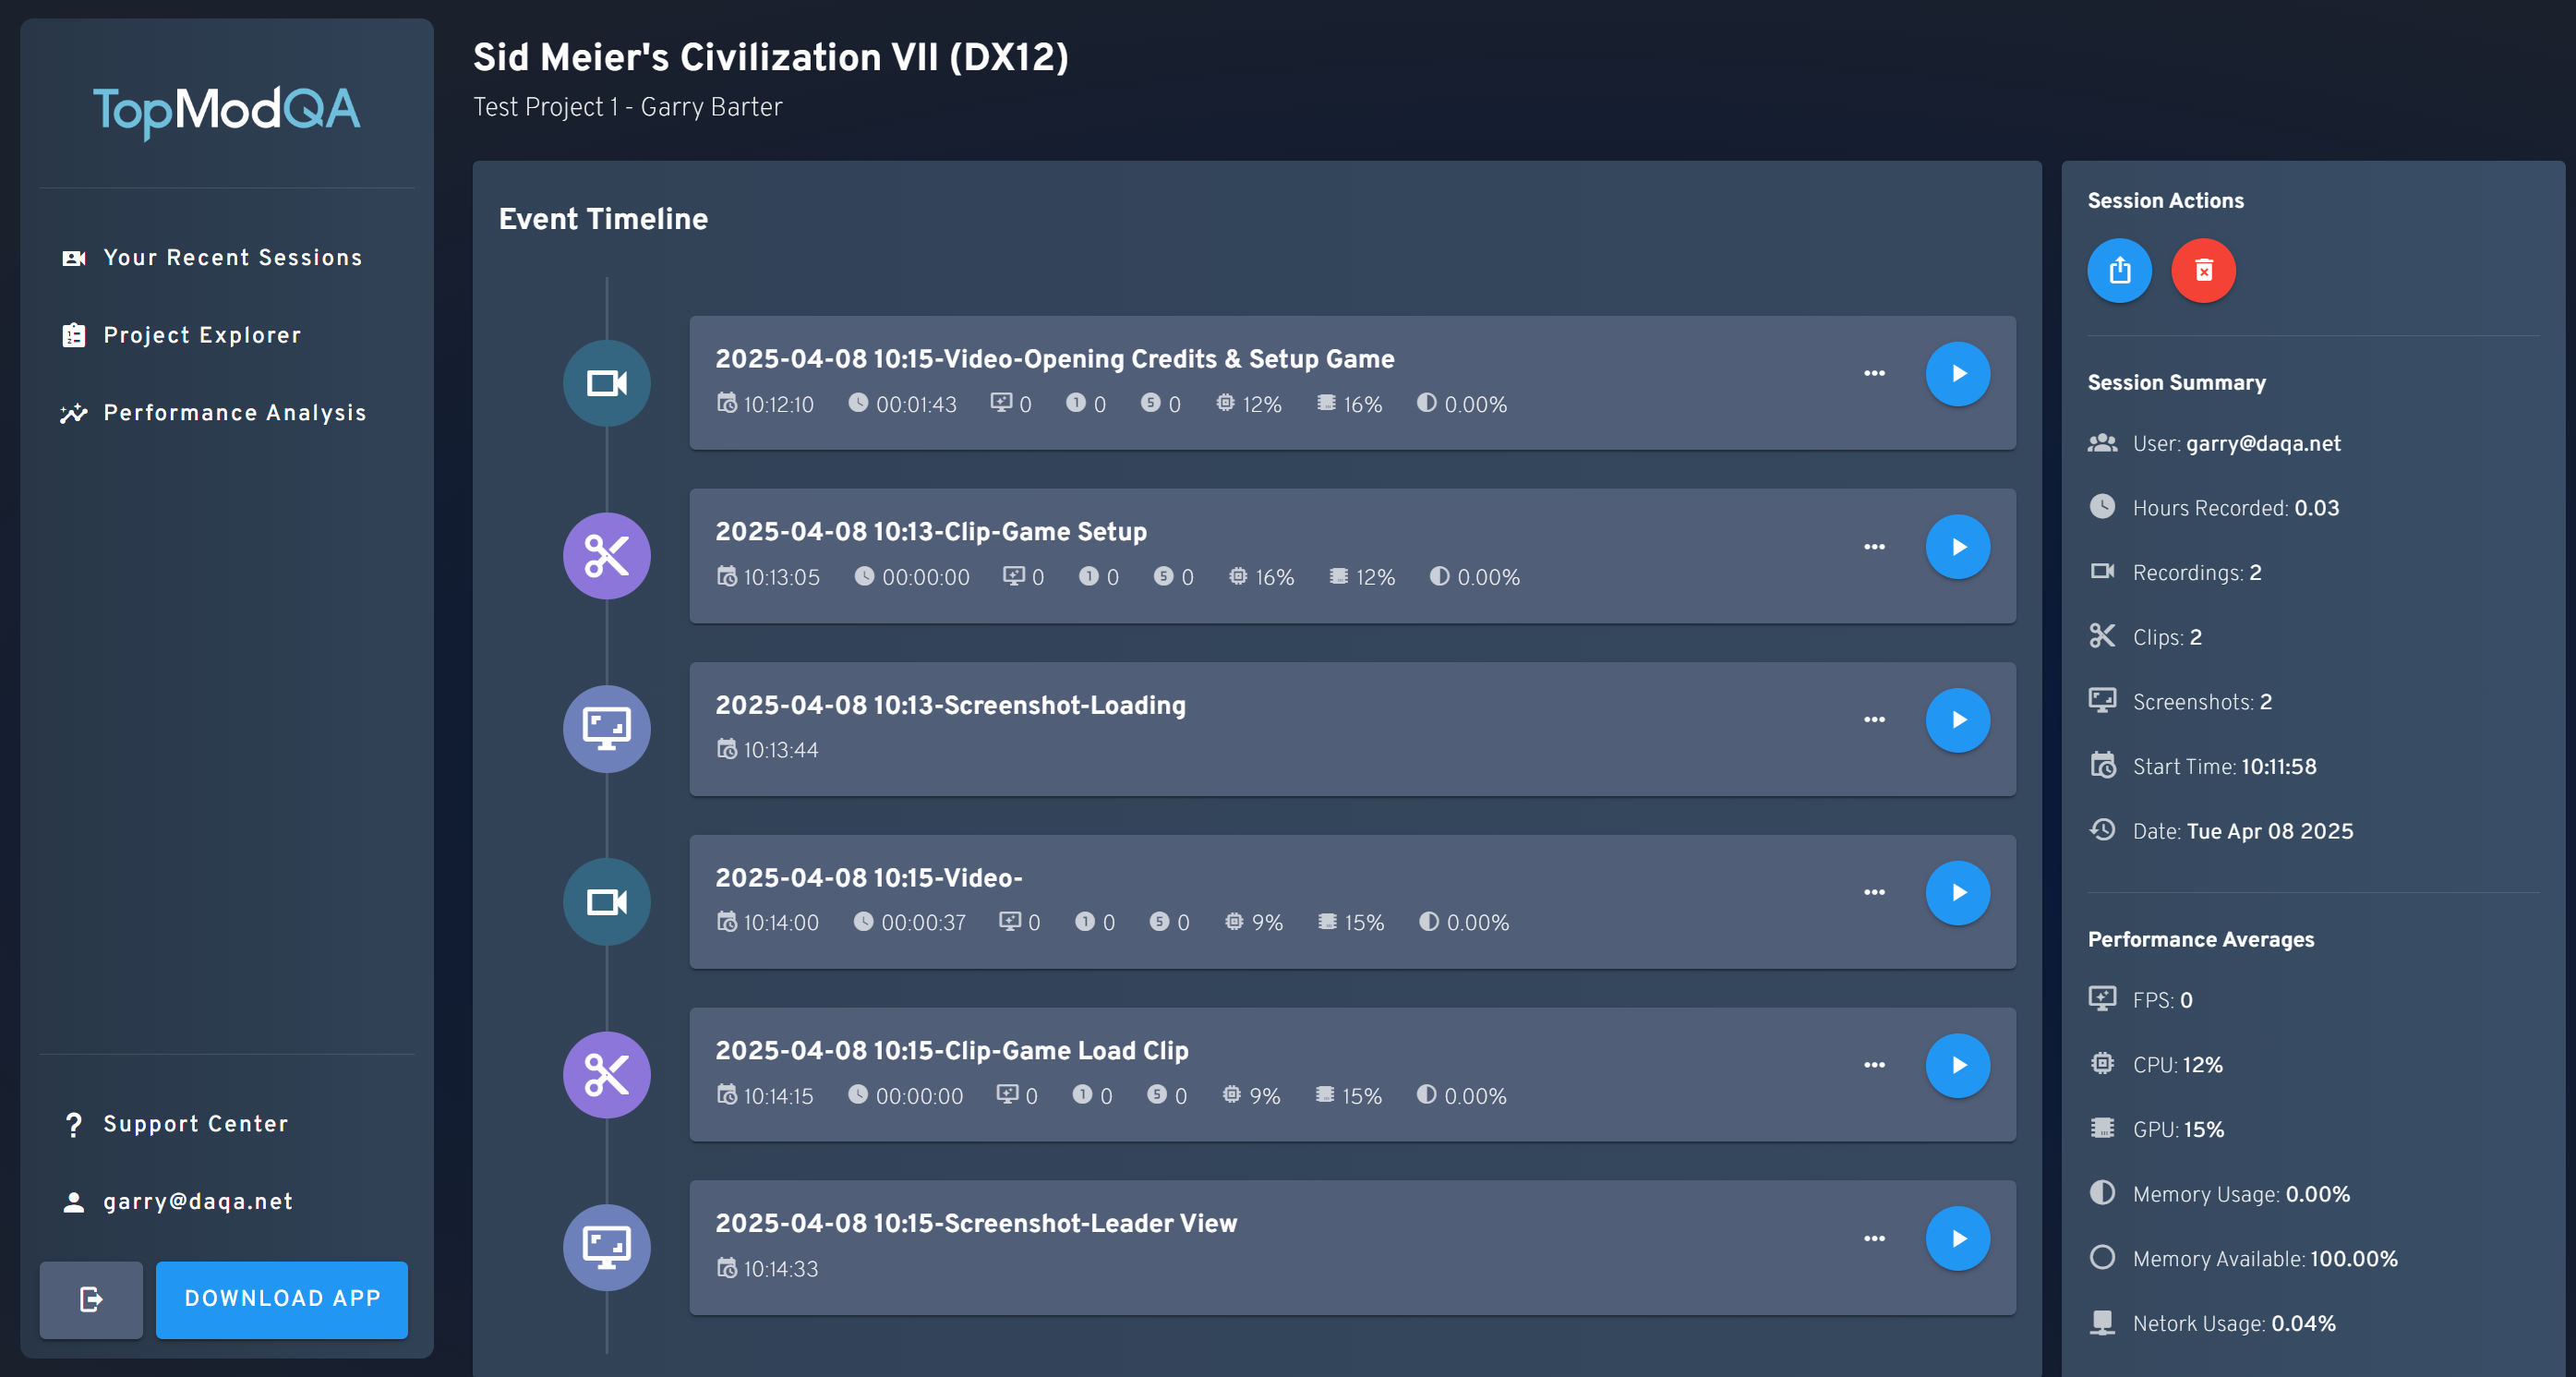
We're going to focus on the Event Timeline in this guide, which is the element in the middle of the page that shows the timeline of Events captured during the Session. Remember, an Event can be a clip or screenshot captured by the tester, or the full recording of the testers test session if they chose to upload that part of the Session. You can tell the type of Event displayed in the timeline by reviewing the icon displayed to the left of the cell. The icons displayed are:
- Camera - Full length recording
- Scissors - A clip the tester wanted to capture
- Screen - A screenshot of the game the tester wanted to upload
If the tester chose to include one, a description of the Event is included as the title for each Event captured. To view one of these Events, click the blue circle with the play icon displayed.
4. View an Event
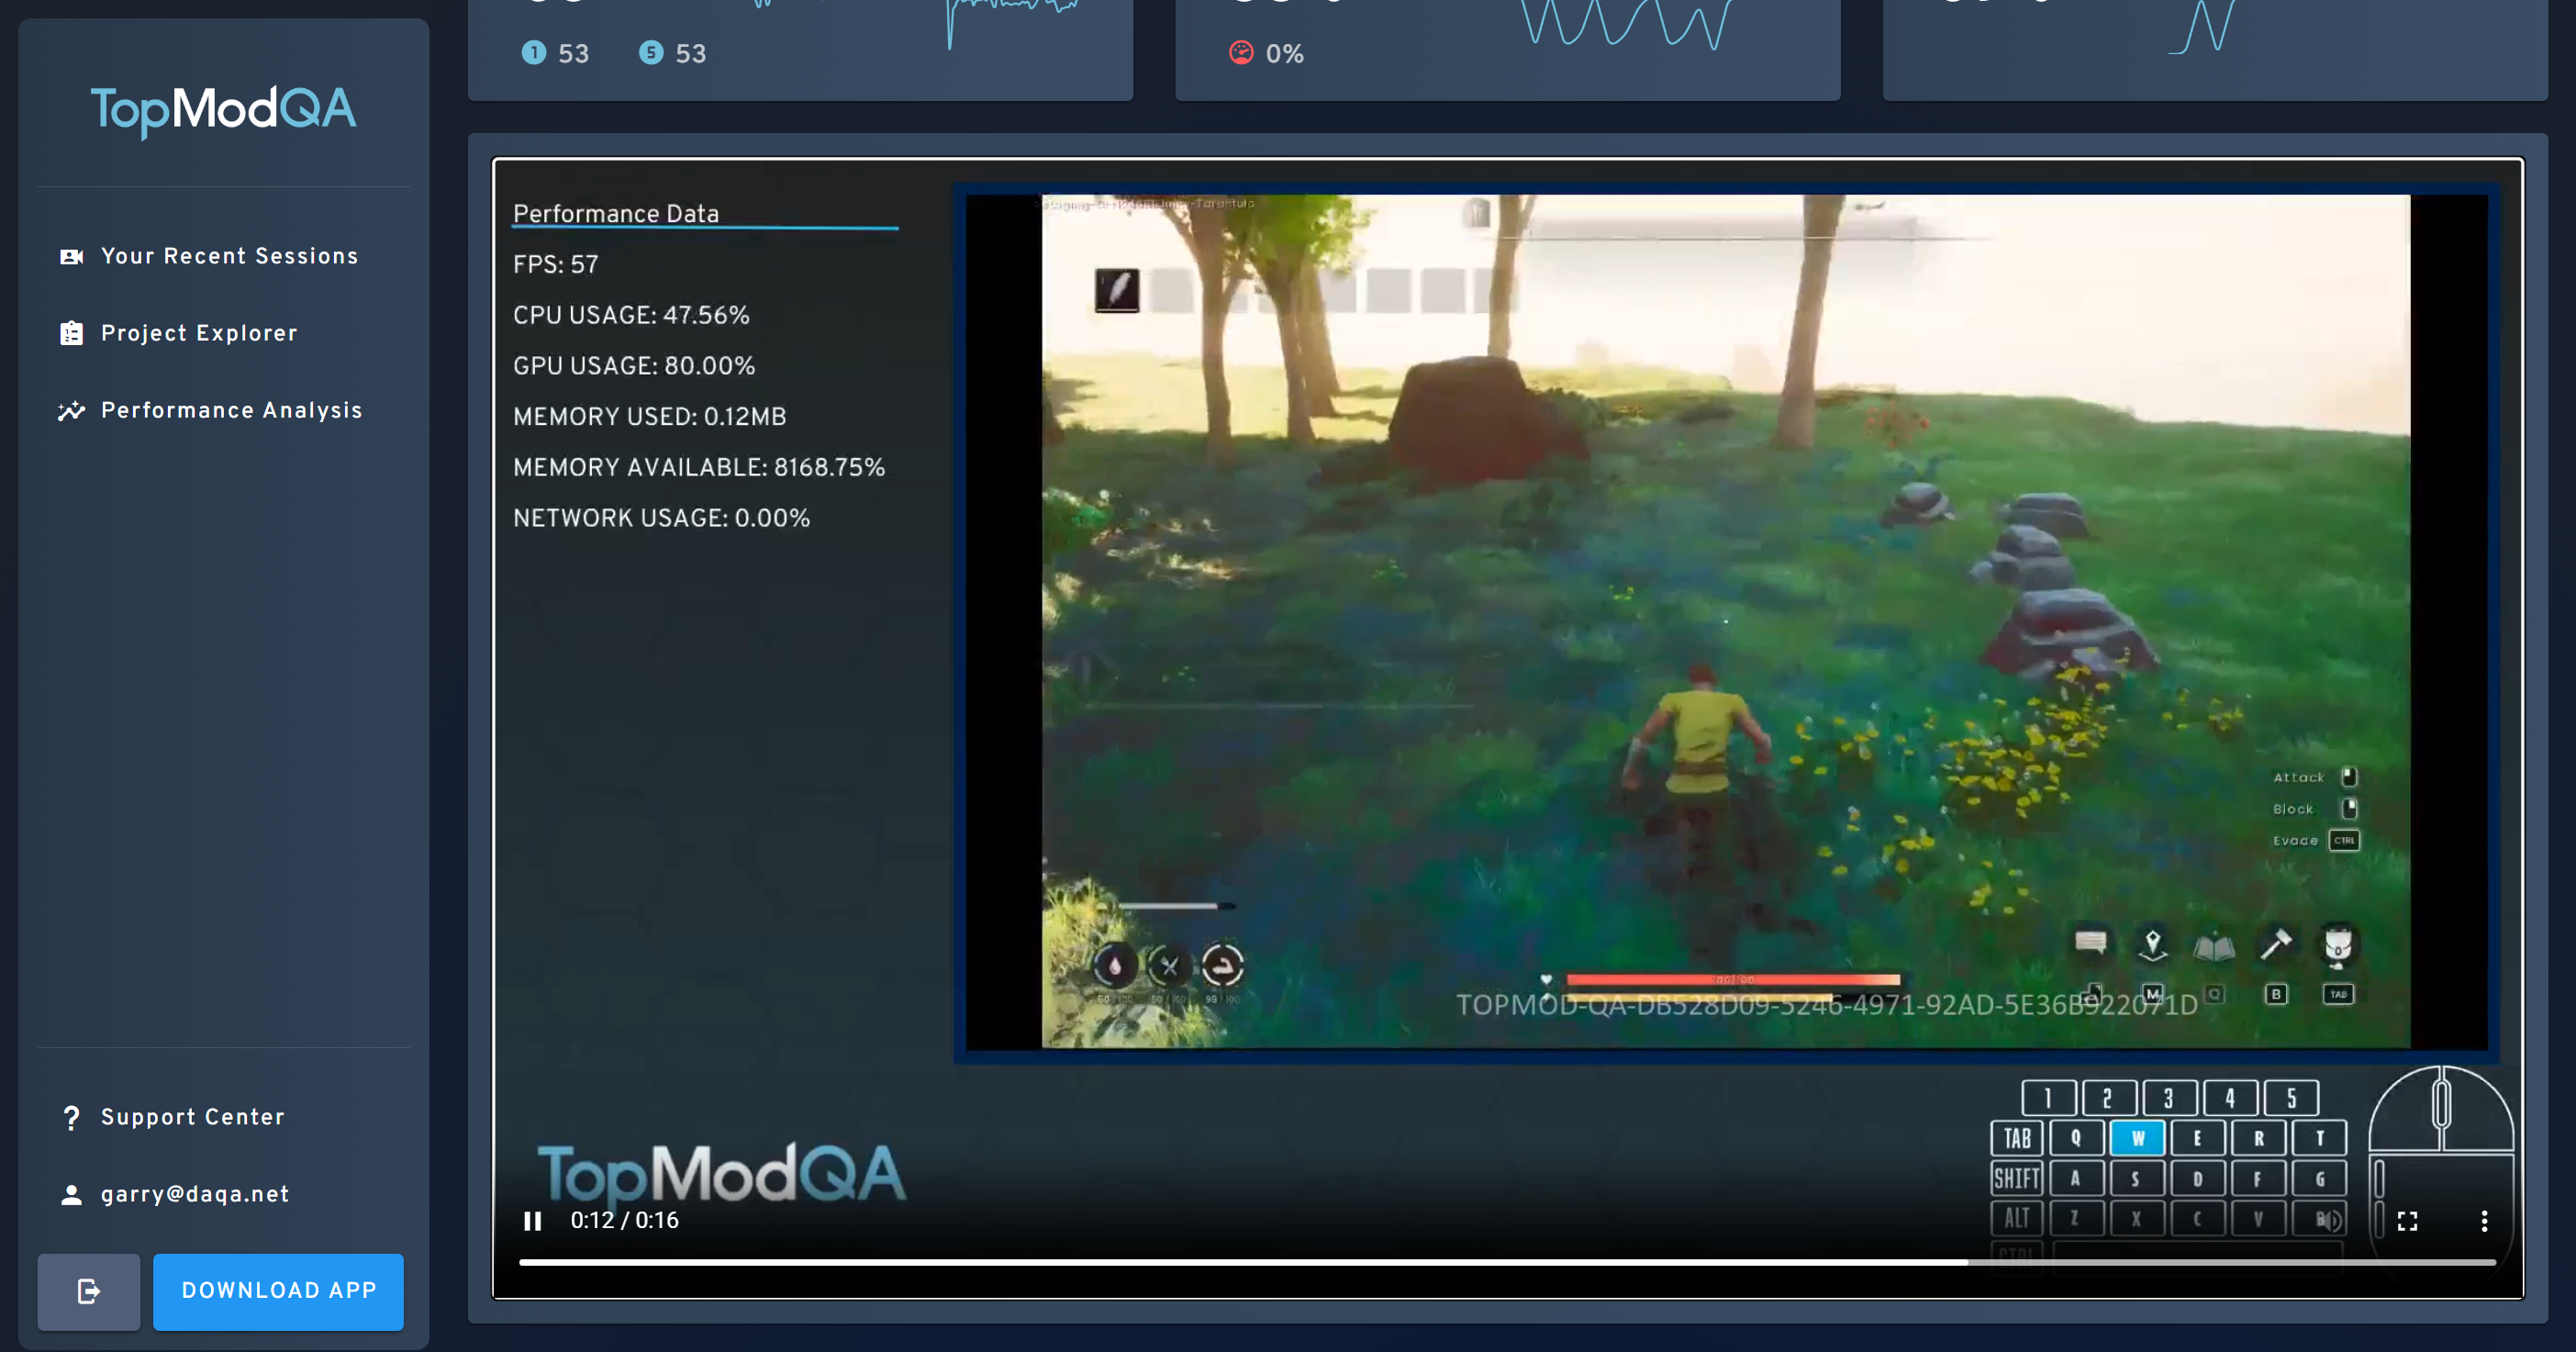
After opening a specific Event, you will be presented with the Event Viewer page. This page displays the content of the Event that was opened, alongside other key information such as the Event information and the Performance data for that Event.
For screenshots, you will be presented with the raw image captured as part of that Event, for Clips and Recordings, you'll be presented the video footage of the event.
TopMod QA utilises a process called "Video Composites" to overlay key information on the captured video footage. This allows us to display user inputs, webcam footage and performance data for the specific frame of the video you are viewing in one place. The image above shows a video composite being played in the middle of the screen and as you can see, includes performance data and user inputs.
To provide this video footage, any recording captured within the native application is uploaded to our servers and this video is compiled. Depending on the length of the footage being processed, this can take some time. Whilst this process is underway, the raw gameplay footage will be displayed. Once the processing has finished, the page will show the composite video from there on in.
Should you wish to, you can scroll down the page to view the Performance data over duration of the video recording. This allows you to identify performance issues within the Event.
5. Sharing With Others
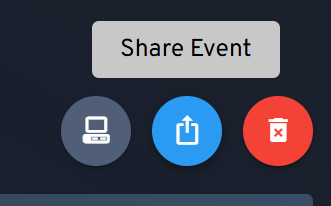
At any time, should you wish to share the Event or Session you are viewing with someone else, you can simply click the "Share Event/Session" button. This is always displayed as a blue circle with the share icon in it as seen below:
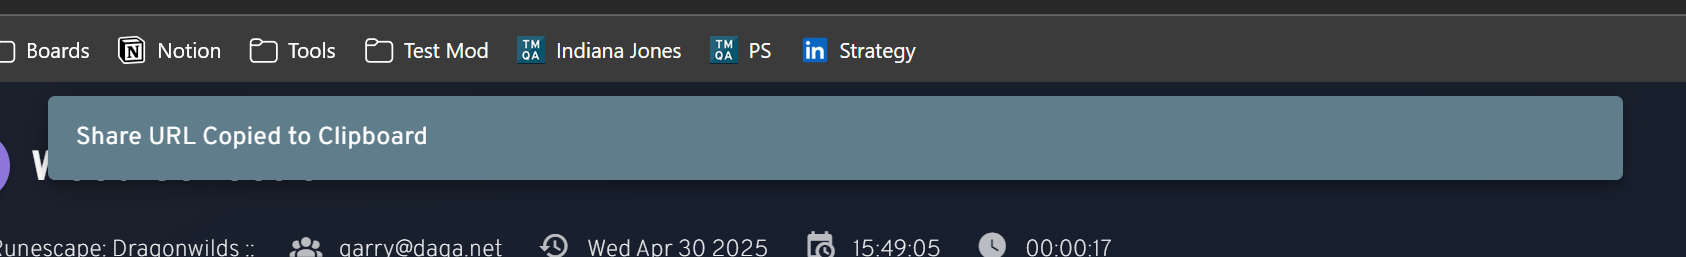
Please note - Any individual with this link can access the Event/Session, they do not require a TopMod QA login to access it so please be careful with sharing this. Any user with this link can access the linked Session but cannot access any other session due to the inclusion of a unique token tied specifically to the Session.
6. Finding Other Sessions In a Project
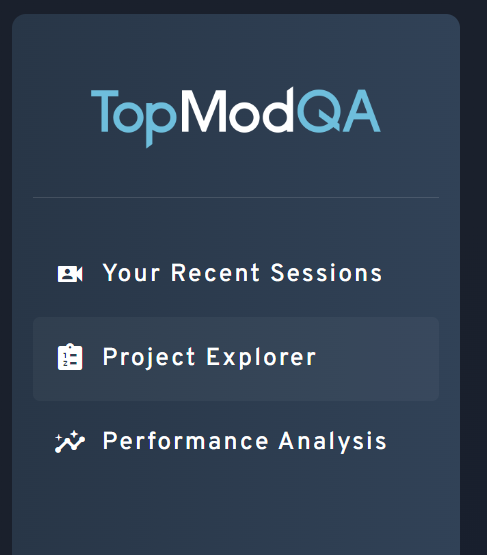
Once you are finished reviewing your selected Event, you may wish to review other Sessions from a Project. This is all possible within the TopMod QA dashboard. To start this process, select the "Project Explorer" from the left hand sidebar.
This will load the Project Explorer page which houses Sessions from all Projects you have access to. You'll be able to see different users contributing to the projects by reviewing the Session list and looking specifically at the "User" column.

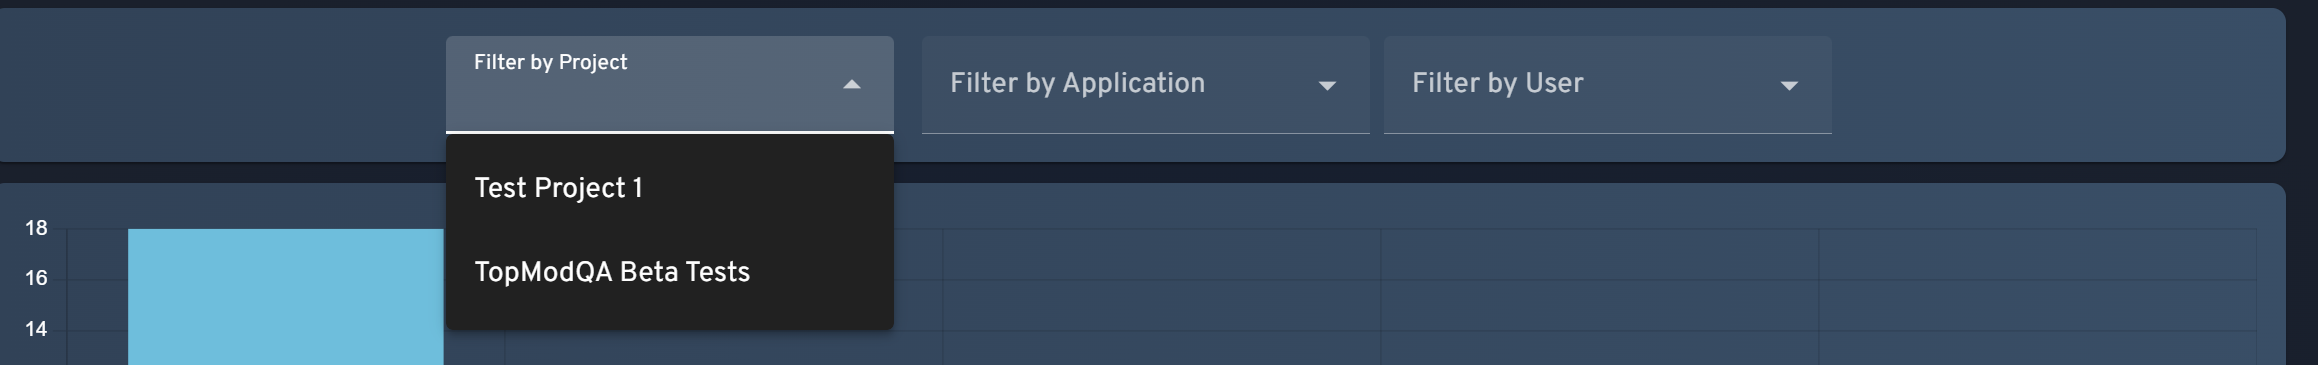
As with the "Your Recent Sessions" page we saw previously, you can filter this list by Project, Application and User by using the filters at the top of the page. Selecting any value in here will update the Session List below the chart.
You can then select any Session you wish to review more by clicking on the blue circle button to open the Session View page for that specific session.
7. Exploring Performance Data
Finally, as all Sessions captured within TopMod QA can have Performance Data included as part of the recording, this can be mapped over time to allow you to find any specific issues with any game you are testing. To review this data, click on the "Performance Analysis" menu option in the left-hand sidebar.
This will open the Performance Analysis page which displays all of the various pieces of data captured, mapped over time.
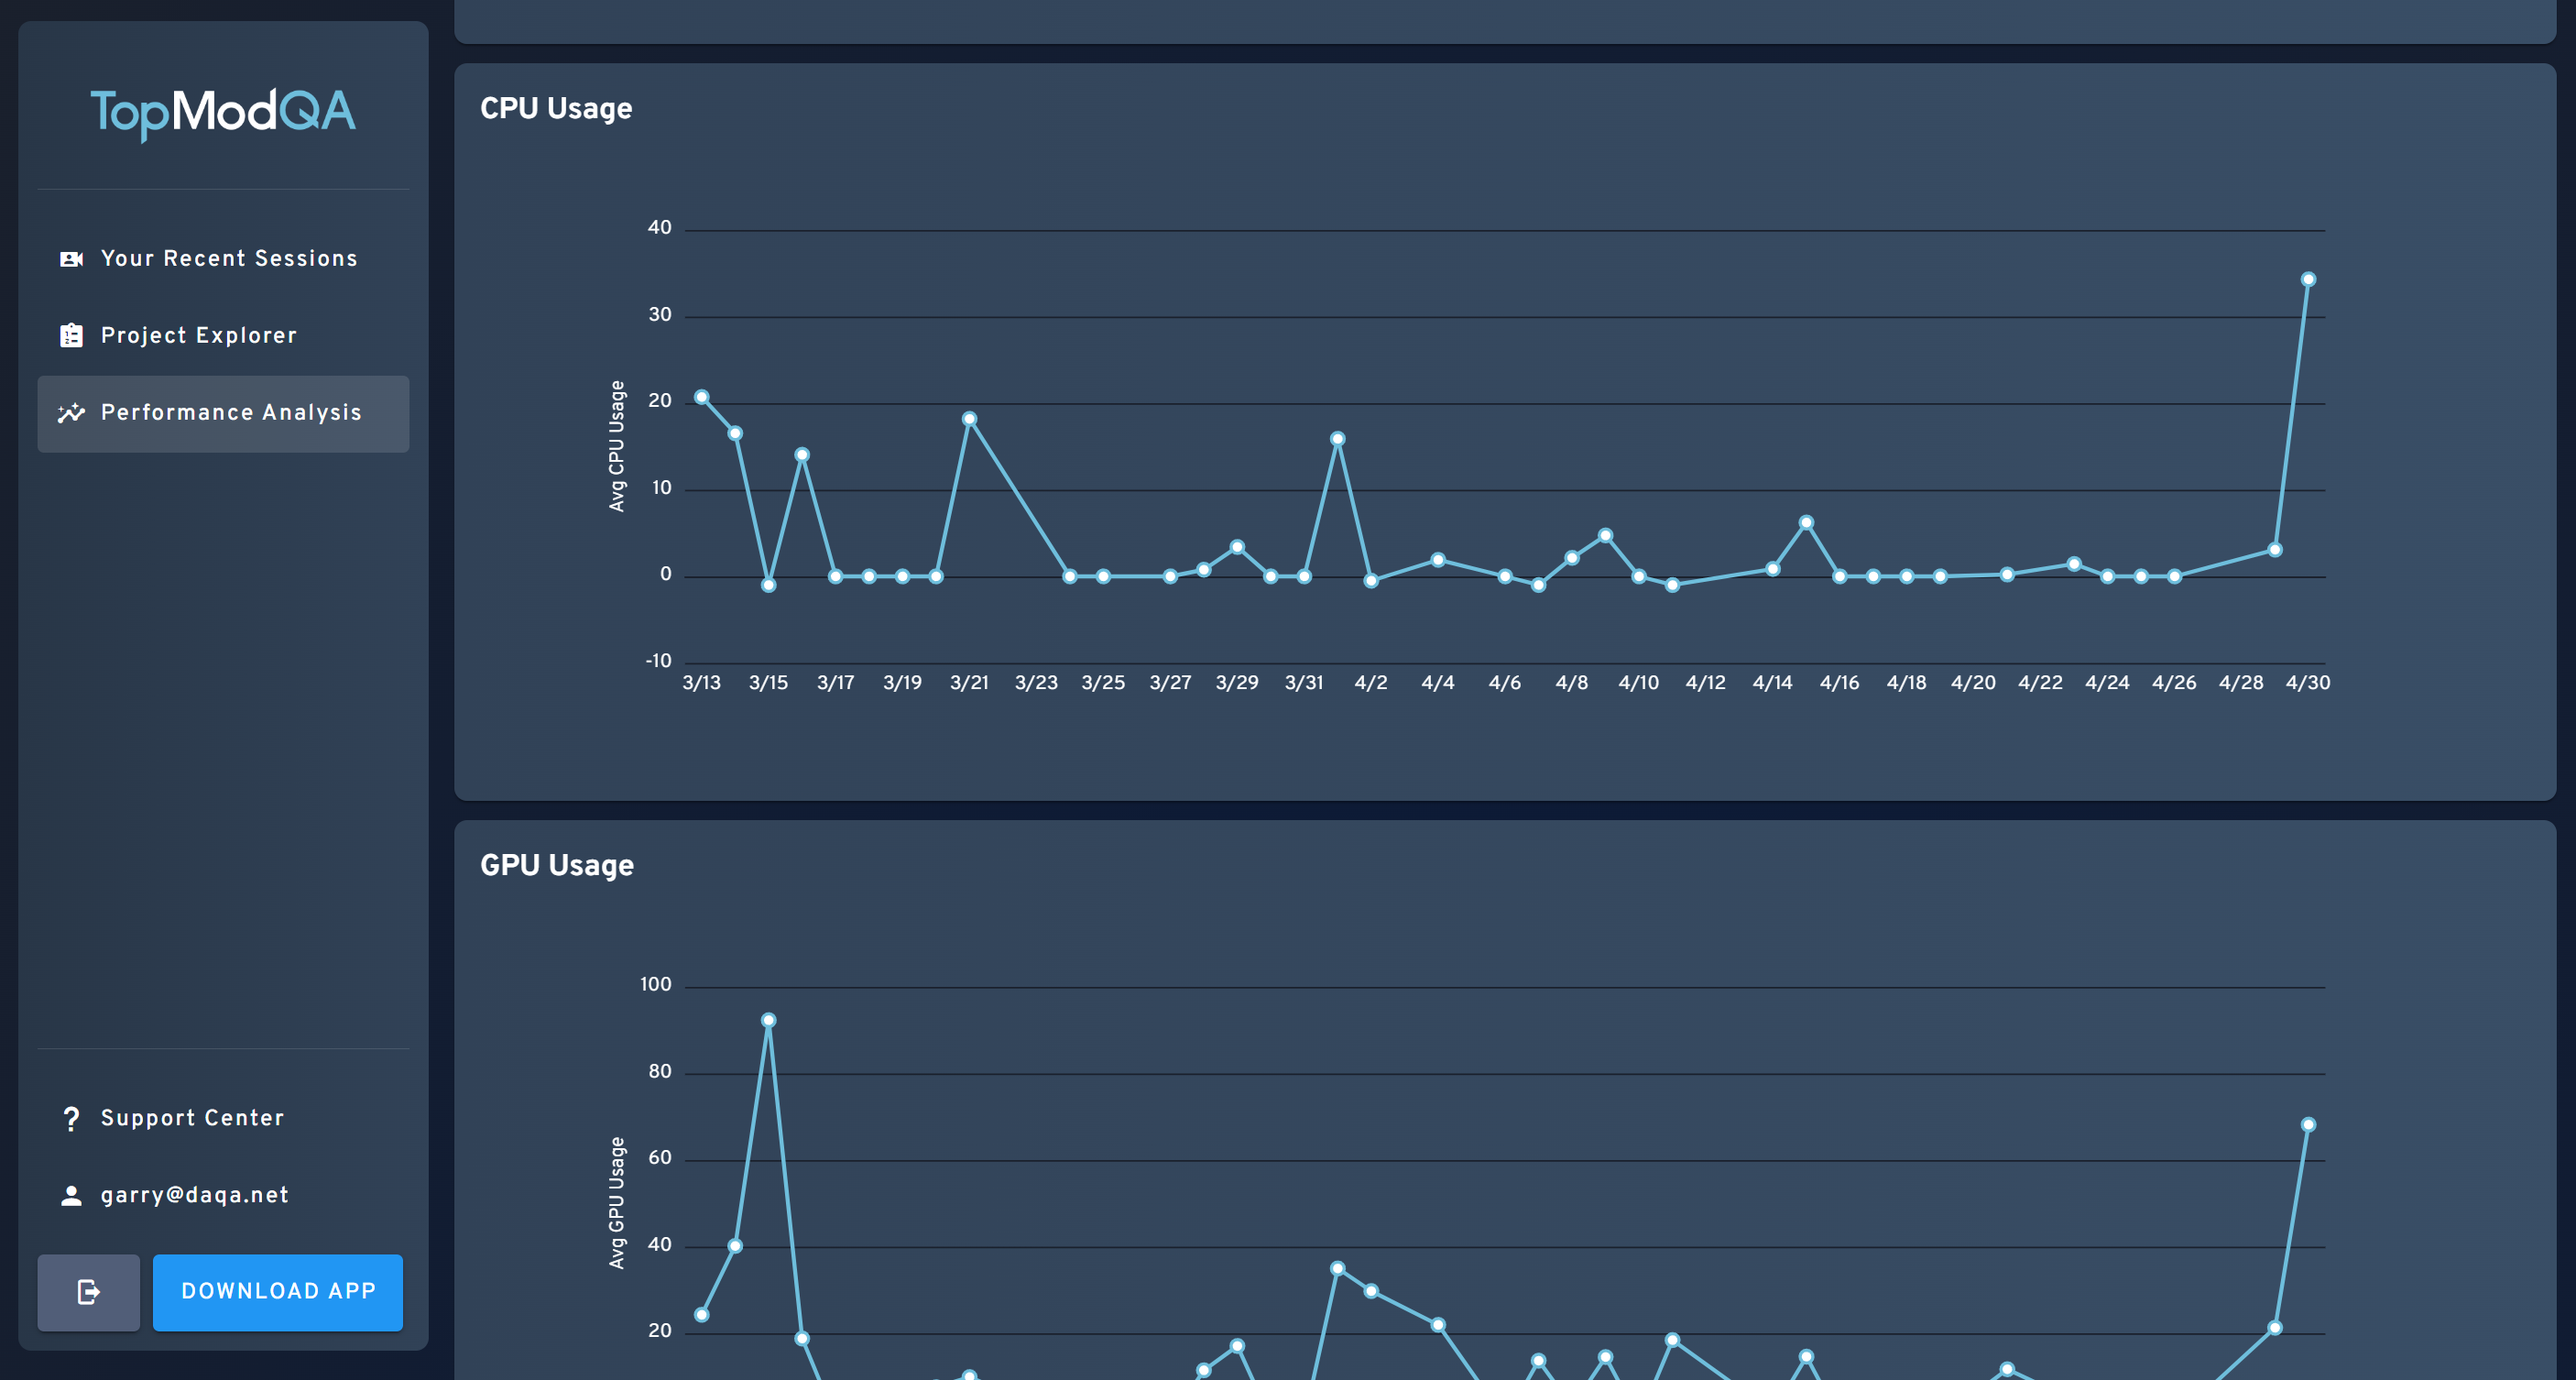
As with other pages in the dashboard, you can filter this using the filters at the top of the page and review the Sessions that match the selected filters in the Session list at the bottom of the page.
And that's it! That's all you need to do to start getting the most out of TopMod QA's new dashboard.
Additional Guides and Tutorials: